How you made money -- or didn’t -- in 2015

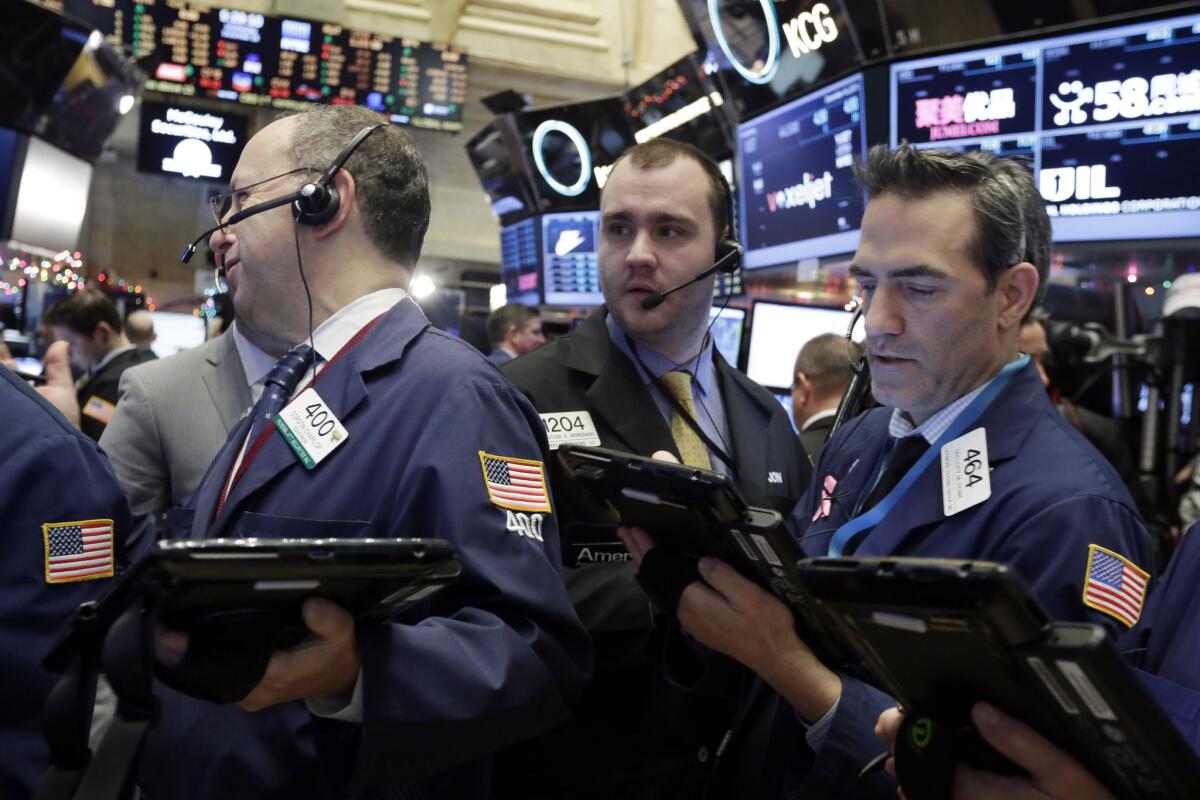
Traders Gordon Charlop, Nathan Wisniewski and Gregory Rowe work on the floor of the New York Stock Exchange.
After three strong years in the U.S. stock market, 2015 was tougher going for many investors. Meanwhile, the bond market was riled ahead of the Federal Reserve’s first interest rate hike since 2006. And overseas, foreign markets were a mixed bag, with some surprising winners.
Here’s a capsule look at how 15 popular investment categories fared for the year.
Blue-chip stocks
Judged by the two best-known U.S. blue-chip stock indexes, the market dozed in 2015: The Dow Jones industrial average, at 17,720 Tuesday, is down 0.6% for the year after rising 7.5% in 2014. The Standard & Poor’s 500 index is up 1% this year after gaining 11.4% in 2014.
Under the market’s surface, however, were wide disparities in individual stock moves as investors faced a tepid global economy, terrorist attacks, China’s currency devaluation, falling commodity prices, uneven consumer spending and generally weak corporate earnings.
Among the 30 Dow stocks, the biggest gainer is Nike, up 34%. The biggest loser: Wal-Mart, down 28%.
The question still to be answered: Did 2015 mark a pause in the six-year-old bull market -- or the end of it?
Mid-size stocks

Shares of mid-size companies such as Boston Beer, which makes the Samuel Adams brews, have long been seen as occupying a sweet spot in the market.
That’s because firms in this group have outgrown small-company territory and may be on their way to large-company status.
From the end of 2009 through 2014, the Standard & Poor’s 400 mid-size stock index rose exactly 100%, beating both the blue-chip S&P 500 (up 85%) and the small-stock Russell 2000 index (up 93%).
But this year the S&P mid-size index is headed for a loss, though a modest one: It’s down 1.9% year to date. Many mid-size firms, like bigger companies, are facing a squeeze on profits. That includes Boston Beer: Hurt by growing competition in the craft beer market, its shares are down 29%.
Small stocks

A Roomba
Like the broader market, shares of many small-company stocks hit record highs in the first half of 2015 as investors bet on a strengthening U.S. economy.
But those hopes dimmed in the second half, and small stocks pulled back more than blue chips, on average.
The Russell 2000 small-stock index dropped 16.8% from its June high to its September low. It has since recouped a chunk of that loss, and now is down 3.7% year to date.
As with many big-name stocks, shares of Roomba vacuum cleaner maker iRobot Corp. -- one of the Russell 2000 stocks -- had been in the red for much of 2015 as sales and profit weakened. But recent pressure from an activist investor who wants to restructure the firm has given the stock a lift. It’s now up 4.7% this year.
Technology stocks

Just as it did in the late 1990s, the technology sector stole the show in the stock market in 2015 -- though not to the same degree as in the dot.com bubble days.
The tech-dominated Nasdaq composite index is up 7.8% for the year, compared with a 1% gain for the Standard & Poor’s 500 index.
Among many of the biggest tech names, however, returns in 2015 have felt a lot like the dot.com era. The standouts include Netflix, up 144%; Amazon, up 124%; Google parent Alphabet, up 50%; and Salesforce.com, up 34%. Long-time star Apple, meanwhile, took a breather: It’s off 1.5% this year.
As usual, the tech sector’s allure is the promise of above-average sales and profit gains in an economy where growth has become harder to find. Also as usual, the danger is that the higher tech shares go, the faster they’ll plummet if growth falls short.
Cash savings

Keeping your money in the bank or in a money market mutual fund kept your principal safe in 2015.
But with short-term interest rates near zero for most of the year, your earnings were infinitesimal.
The average money market mutual fund earned an average annualized yield of just 0.02% for most of 2015, according to iMoneyNet. The average one-year bank certificate of deposit nationwide paid 0.27% at the start of 2015, and is still at that level, according to Bankrate.com.
With the Federal Reserve’s decision this month to raise its benchmark short-term rate from zero to a minimum of 0.25%, savings rates should begin to move up -- eventually. But because banks are so flush with deposits, they’re in no rush to boost yields.
Treasury bonds

Yields on U.S. Treasury securities rose across the board in 2015 as investors began to anticipate that the Federal Reserve would raise its benchmark interest rate.
Not surprisingly, the biggest increases were on shorter-term Treasuries, because they’re directly influenced by the Fed’s rate.
A one-year T-bill, for example, now yields 0.66% compared with 0.23% at the start of the year. Yields on longer-term Treasuries moved up much less. The 10-year T-note yield is at 2.31% compared with 2.17% a year ago. Longer-term yields take their cue more from the inflation outlook than from the Fed’s rate.
The modest rise in the 10-year T-note yield this year suggests investors still have low expectations for long-term inflation -- and high regard for Treasury bonds as a relatively safe investment.
Corporate bonds
Corporate bond yields rose more than Treasury bond yields in 2015.
In large part that was because some investors began to worry about companies’ creditworthiness as corporate earnings growth slowed.
The worst-hit bonds were “junk” securities issued by the highest-risk companies. The average yield on an index of junk bonds tracked by BofA Merrill Lynch has surged to a four-year high of 8.8% from 6.7% at the start of the year. That knocked junk bond mutual funds for losses as older bonds sank in value.
The average junk fund is down 4.3% this year, as principal losses more than offset interest income, according to Morningstar Inc. Bond funds that own high-quality securities have suffered less: their average decline year-to-date is a modest 1.2%.
Tax-free municipal bonds

Statehouse interior in Sacramento.
Municipal bonds were a bright spot in the fixed-income market in 2015, as yields rose little or even declined.
Investors were drawn to munis as a relative haven, in part because of the improving finances of many state and local governments. Though there were grim headlines about the financial health of a few government entities, including Puerto Rico and Illinois, they failed to rattle most muni bond owners.
Every muni bond mutual fund category tracked by Morningstar has a 2015 positive total return, meaning interest earnings plus or minus principal change. The average fund that owns long-term California muni issues is up 3.6% this year. Because muni interest is tax-exempt, the true return is higher.
Inflation-protected bonds

Treasury inflation-protected securities, or TIPS bonds, were introduced by the U.S. Treasury in 1997.
The idea was to offer a bond with a return that is insured against erosion by inflation. A standard bond pays a fixed rate of interest until it matures. If inflation runs above that rate, the bond owner’s return is effectively wiped out.
With TIPS bonds, the principal value of the security increases to match inflation. That makes TIPS useful as an insurance policy against unexpected rising inflation over the long term.
But because investors treat TIPS as long-term bonds, their daily prices fluctuate with market interest rates. And because market rates rose this year, TIPS fell in value: The average mutual fund that focuses on TIPS bonds is down 2.6%, according to Morningstar.
Target-date retirement funds

Popular among many 401(k) savings plan investors, target-date retirement mutual funds promise to maintain a mix of stocks and bonds that will automatically tilt toward more bonds -- and, in theory, less risk -- as the investor’s retirement date nears.
And by staying diversified, the funds avoid the volatility that investors can suffer if they’re solely in stocks or solely in bonds.
In 2015, a down year for many stock and bond sectors alike, most target-date funds are showing only slight losses. Funds with a target retirement date in the period 2021 to 2025, for example, are down 0.8% on average, according to Morningstar. The 2031-2035 target-date funds are off 0.6%.
If target-date funds help investors feel better about staying put in markets in volatile times, that’s half the battle.
European stocks

European stocks gave back much of the rally they enjoyed early in the year, but still are finishing in the black for U.S. investors -- despite the strong dollar’s depressant effect on returns.
The average European stock fund owned by U.S. investors is up 3.3% this year, according to Morningstar. The Stoxx 600 index of major European shares is up 6.4%. Many global investing pros continue to bet that Europe’s long-suffering economy will pick up speed in 2016, so they’re reluctant to sell.
The lure of European stocks is partly based on expectations that the European Central Bank will continue to keep short-term interest rates near zero, even as the U.S. Federal Reserve has begun to raise rates.
Asian stocks

Shanghai
Stocks in Asia were a mixed picture in 2015.
Japanese stocks were the stars, as shares soared in the first half of the year on optimism that the nation’s economy was finally on a path to sustained growth.
The market slumped in late summer with most other global stocks as fears mounted over China’s slowing economy. But Japan’s Nikkei stock index still looks set to end the year with a gain of around 9% as the Bank of Japan continues to pump money into the financial system.
By contrast, Hong Kong stocks are down 6.8% this year and the Indian market is off 5.2%. In a surprise, the Shanghai market has recovered more strongly than expected from its mid-year crash, and is on track to post a net gain of 10% in 2015 -- though it’s still down 31% from its summer peak.
Latin American stocks

Brazilian stock exchange
Latin America was a disaster zone for foreign investors in 2015, due mainly to dramatic currency devaluations that eviscerated market returns.
Measured in pesos, the Mexican stock market is up 0.6% for the year. But the plunge in the peso against the dollar means American investors are in the red. It now takes 17.3 pesos to equal $1, up from 14.4 in January.
Investors in Brazil and Argentina fared much worse as those economies and currencies tanked. One measure of how awful returns were across the region: The average mutual fund that owns a diversified portfolio of Latin American stocks is down 28.7% year to date measured in U.S. dollars, according to Morningstar.
Emerging-markets stocks

Istanbul skyline
Once global investors’ greatest hope, emerging-markets stocks have mostly been a huge disappointment over the last decade.
In 2015 the situation got far worse, as commodity prices plunged and dragged down economies that are big exporters of raw materials, such as Russia and Brazil.
Then, China’s surprise currency devaluation in August triggered declines in many other emerging-market currencies, from Turkey to Mexico to India.
The result: The average diversified emerging-markets stock mutual fund is down 13% this year in dollars, according to Morningstar. And over the last five years the funds have lost an average of 4% a year -- compared with a 12.9% average annualized gain for the U.S. S&P 500 index.
Gold
Gold’s slide continued for a fourth year in 2015, as investors looking for a haven -- the metal’s historical role -- turned to other alternatives.
At $1,070 an ounce, gold is down $114, or 9.6%, from the end of 2014. The price is off 44% from the metal’s all-time high of about $1,900 reached in 2011.
Gold saw a phenomenal rise from 2000 to 2011 as investors worldwide poured in amid a broad rise in commodity prices. But for the last four years commodities have been in a downtrend, in part because of waning demand in China.
Gold also has been slammed by the dollar’s strength, because the metal often is viewed as directly competing with the greenback. Gold’s slump has devastated shares of mutual funds that focus on gold- and silver-mining stocks: The average fund is down 22.3% this year, according to Morningstar.


