Fire, mudflows, evacuations and deaths: Maps show how Montecito has been hit
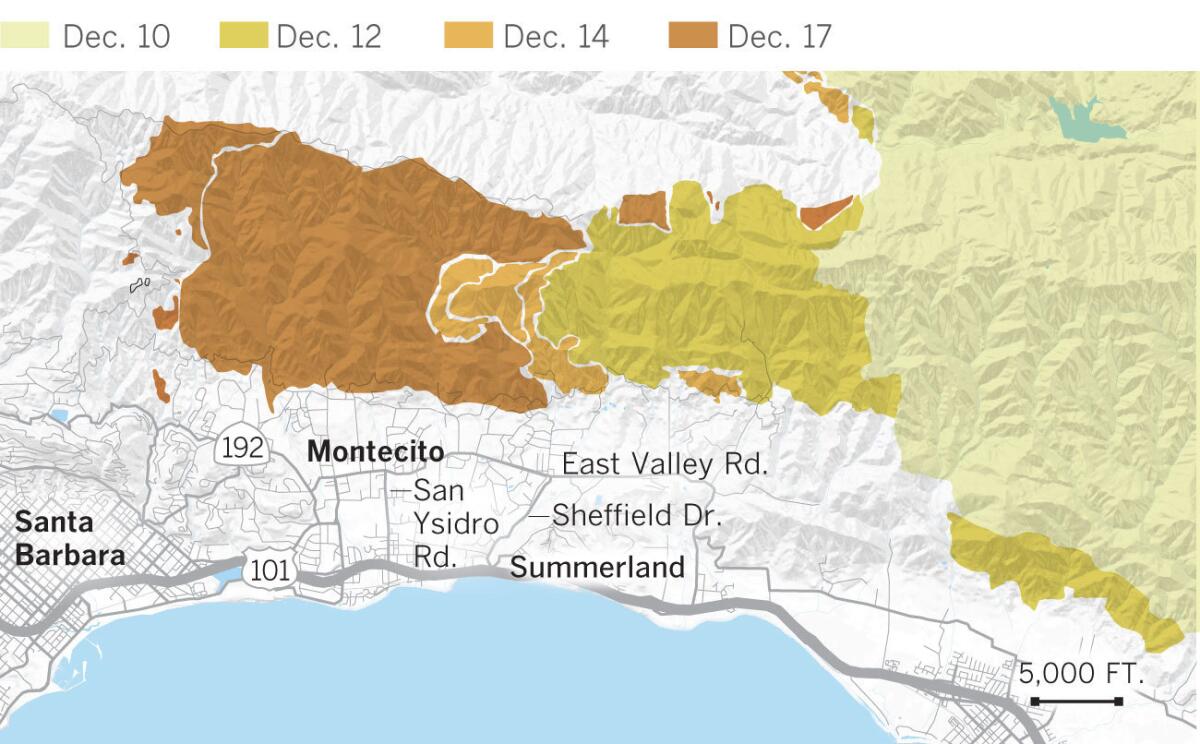
The Thomas fire began its destructive march 30 miles east of Montecito on Dec. 4. Two weeks later, the blaze had begun to bear down on the city, eventually leaving fire-scarred hillsides prone to deadly mudflows.
Thomas fire progression
The Thomas fire became California's largest wildfire on record, burning more than 280,000 acres across Ventura and Santa Barbara counties.
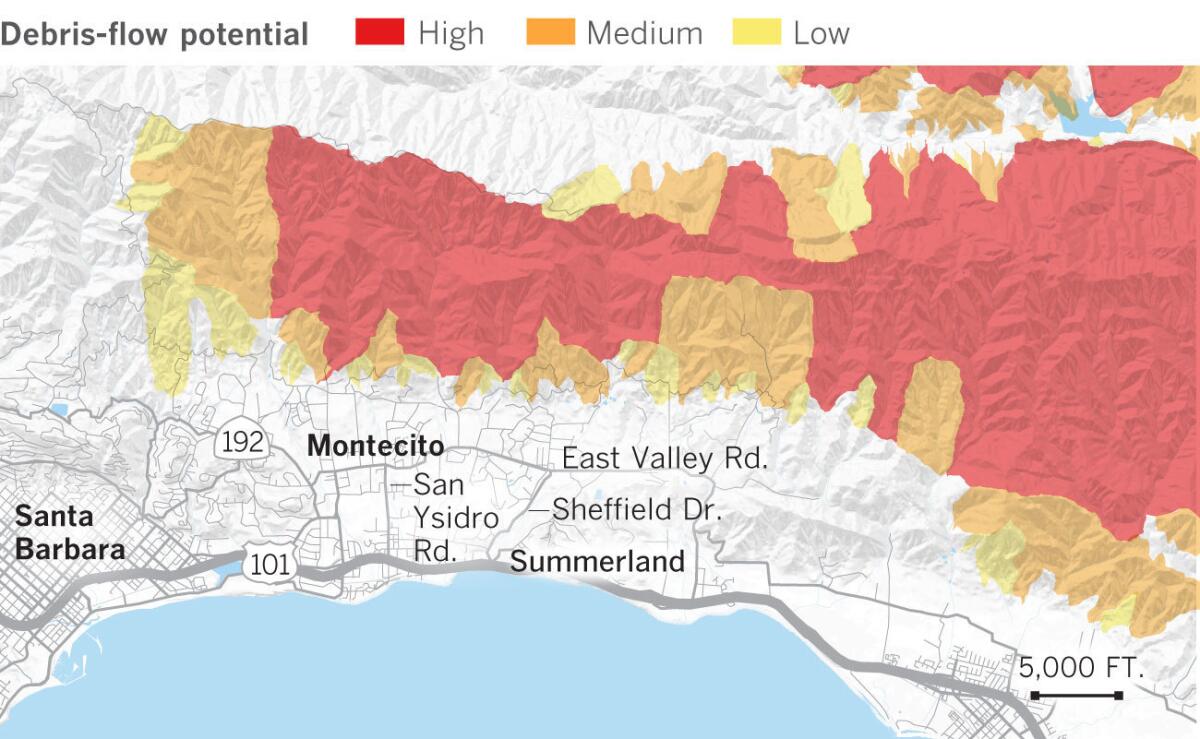
Debris flow potential
In the weeks since the deadly fire, the U.S. Geological Survey studied the burn area to determine its vulnerability to flash floods, mudslides and debris flows. The likelihood of a debris flow is based on a peak 15-minute rainfall intensity of 24 millimeters per hour. Scientists used burn severity, soil properties, rainfall data and a number of other factors for their estimation.
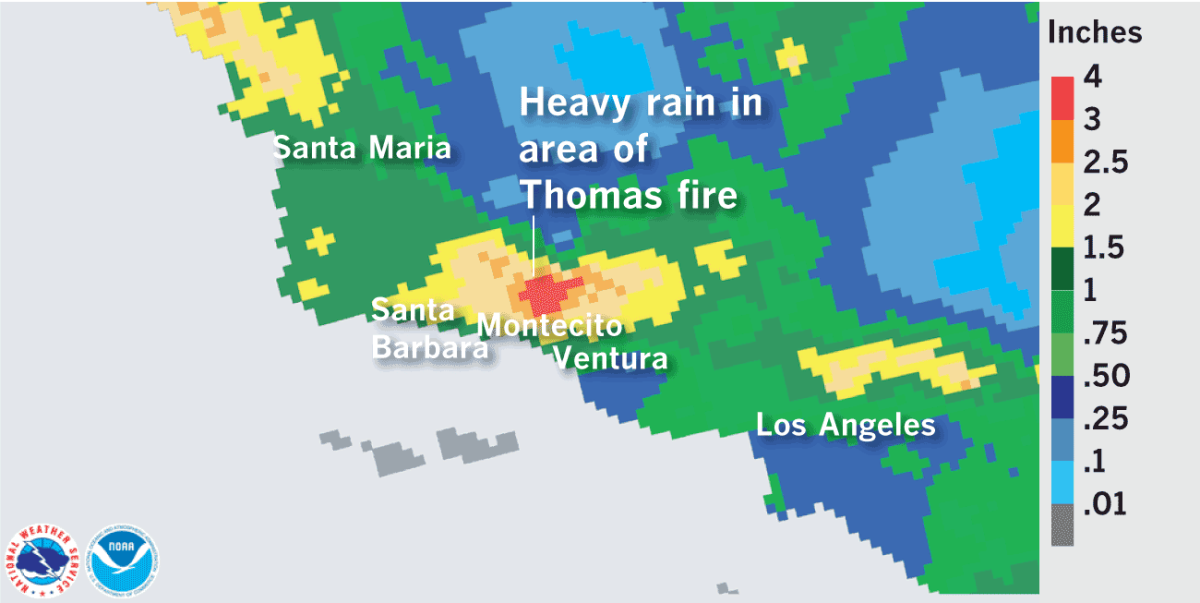
Stormy Tuesday
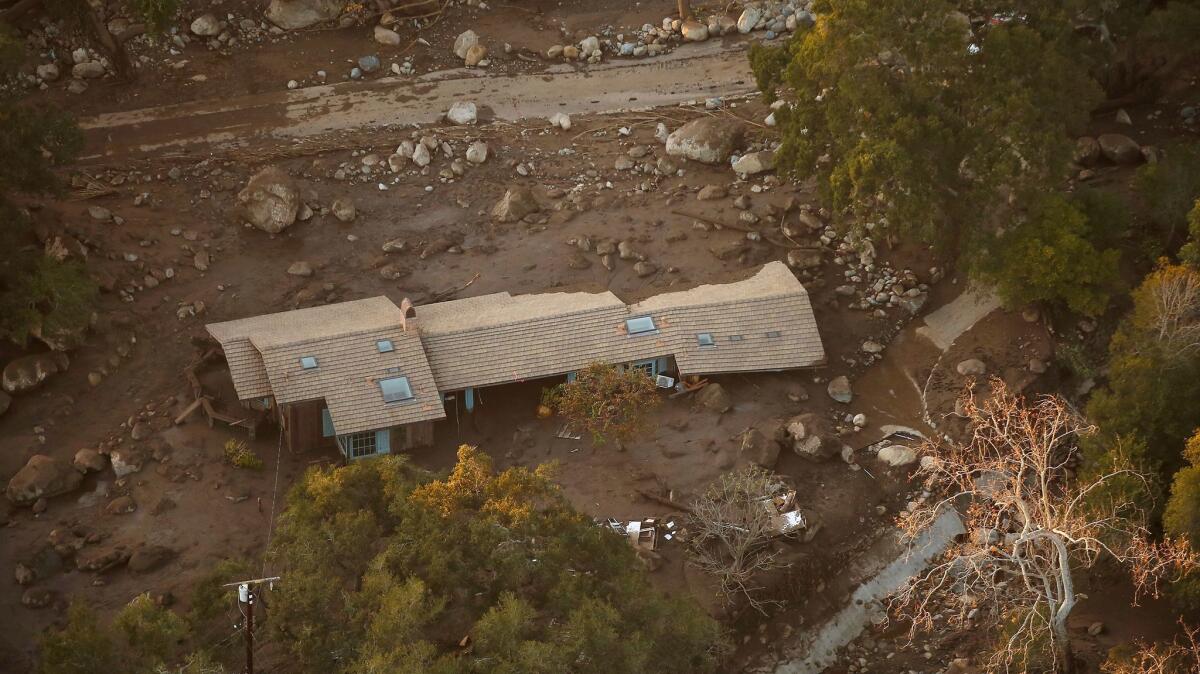
On Tuesday, Jan. 9., California’s first major storm in nearly a year unleashed additional devastation in the burn zone. Up to 4 inches of rain fell on the Montecito area.
Evacuation zones
As of Thursday, Jan. 11, at least 17 people had died in the mudslides, and at least eight people were still unaccounted for.
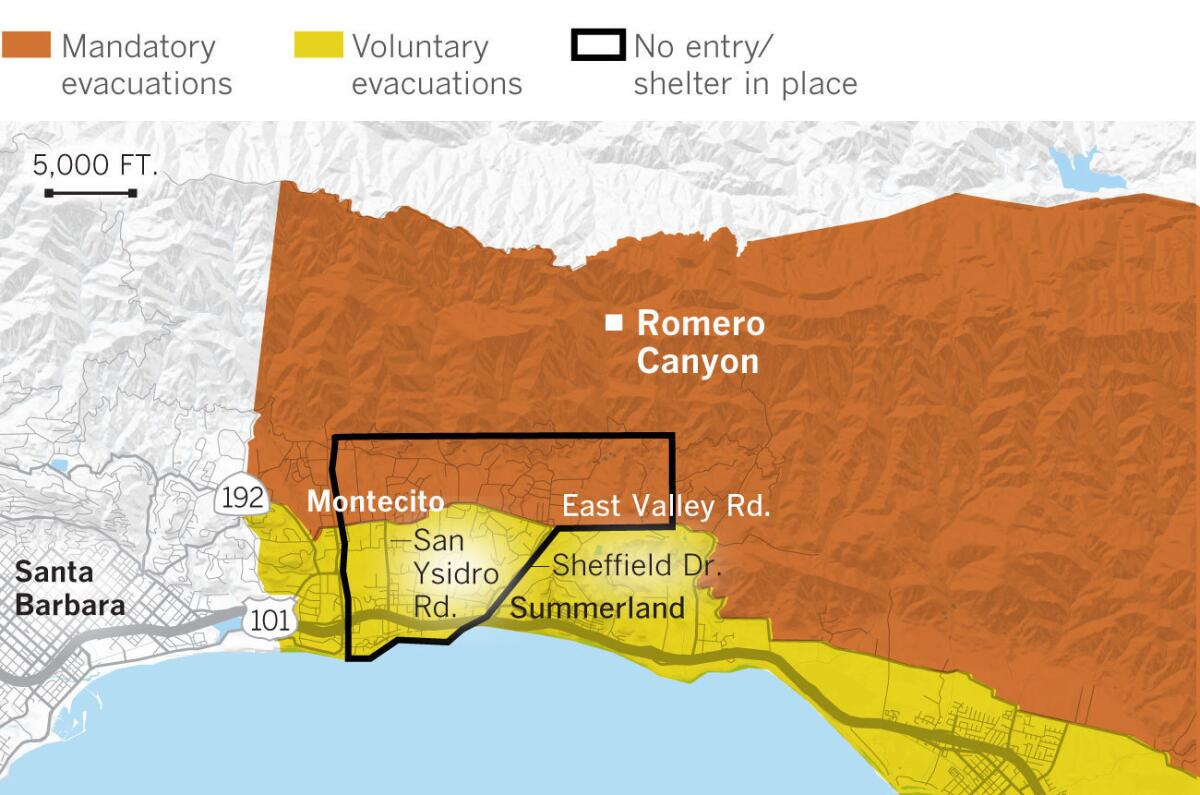
Sources: Santa Barbara County, U.S. Geological Survey Landslide Hazards Program, California Department of Forestry and Fire Protection, Inciweb, Mapzen, OpenStreetMap, National Oceanic and Atmospheric Administration and the National Weather Service