Stat-conscious NBA switches to the (advanced) metric system

Facing the nearly floor-to-ceiling windows in their office, Rajiv Maheswaran and Yu-Han Chang can catch a glimpse of Staples Center.
To see the future of the NBA they only have to swivel their heads. Whiteboards inside their office are filled with algorithms in shades of red, blue and green. Programmers sit clustered around computers inputting lines of complex code.
What resembles gibberish to anyone without a degree in computer science could help NBA teams find optimal ways to grab rebounds and defend pick and rolls through a proprietary software system developed by Maheswaran and Chang. The researchers from USC’s Viterbi School of Engineering are the NBA’s newest go-to guys, distilling the oceans of analytical data that will be available league-wide for the first time this season through motion-tracking cameras placed in every arena.
“You have to have a particular degree of creativity just to know what is possible,” said Maheswaran, who has degrees in math, physics and electrical engineering. “It’s 1,000 times more information than anyone had before.”
As the cursor flitted across his laptop screen, Maheswaran displayed a dizzying array of visual tools that teams could use to tweak lineups and position players for favorable outcomes. One depicted a basketball court overlaid with shaded green squares, the darkest squares showing the most likely spots where a rebound would fall given the shot taken. Another showed players’ success rates in pick-and-roll combinations.
Even the biggest proponents of advanced statistics concede that these insights are only one component of a team’s decision-making, just like game film and traditional player evaluations.
But the system Maheswaran and Chang have licensed to the Clippers and three other NBA teams through their start-up company, Second Spectrum, could influence the way their clients play and even construct their rosters.
The Golden State Warriors used similar analytics last season when their defense yielded a staggeringly high percentage on three-pointers. Assistant general manager Kirk Lacob, a Stanford graduate and son of Warriors majority owner Joe Lacob, said the team checked its defensive rotations, lineups and fatigue metrics and made tweaks accordingly. Lo and behold, teams no longer shredded the Warriors’ perimeter defense.
“Did it make 100% of the difference, 50% of the difference, 20% of the difference?” asked Lacob, whose team uses a Palo Alto-based data processing company called MOCAP Analytics. “I don’t know the answer. The most important thing is it did help us identify a problem and then eventually correct it.”
Statistical analysis in the NBA has lagged roughly a decade behind its use in Major League Baseball, popularized by Oakland Athletics General Manager Billy Beane and his “Moneyball” approach. One reason is because baseball is slower and more situational than its free-flowing counterpart, whose analytics are largely based on emerging technology.
Golden State, Dallas, Boston, San Antonio, Houston and Oklahoma City were the first NBA teams to use the motion-tracking cameras, developed by STATS LLC, starting with the 2010-11 season. Last season 15 teams used the system, with the Lakers and Clippers among the holdouts.
The NBA recently decided to pay for every team to have the system so that a complete data set would be available league-wide and selected information could be distributed to fans via NBA TV and NBA.com. Some teams will put a sampling of the data on their scoreboards, such as how many miles a player has run in a game.
It all starts with six tiny computer-vision cameras strategically placed in the rafters of each NBA arena that record the movement of every player, referee and the ball 25 times a second. The data is electronically transmitted to STATS to be categorized into passes, dribbles, shots and rebounds, among other groups. “It has potential to unlock a lot of the secrets of our game,” said Steve Hellmuth, the NBA’s executive vice president of operations and technology.
Teams can access relatively simple information such as the number of passes into the post in 60 to 90 seconds while games are in progress. More complicated statistics are available postgame after the data is processed through sophisticated algorithms. Although many of the numbers will be available to all 30 teams, customized reports generated by specialized providers such as STATS and Second Spectrum can be viewed only by the teams requesting them.
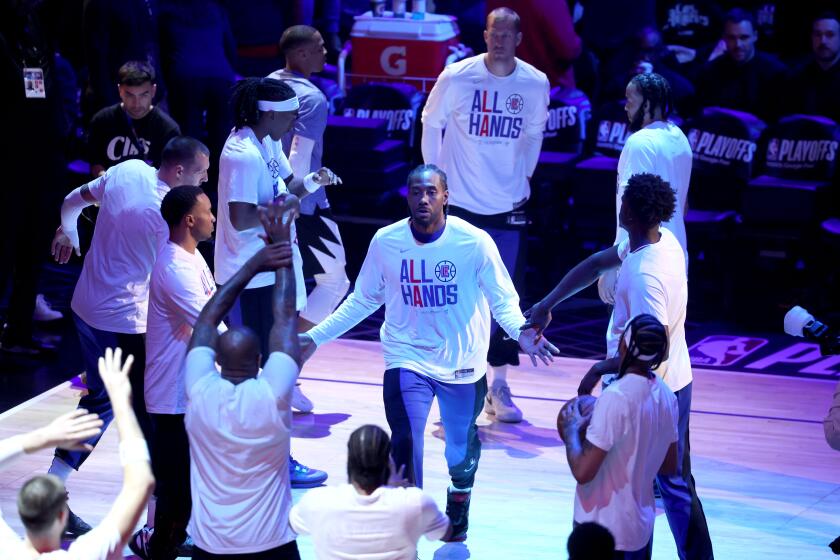
Several teams, including the Clippers, have also hired employees to help sift through the information. “Every team is going to have their own formula that they will create that works for their team in scouting and everything,” Clippers Coach Doc Rivers said. “We don’t know our formula yet, so we’ll have to figure that out.”
Lakers assistant Kurt Rambis, who will largely be responsible for the team’s defense, said a thick packet of data may yield only a handful of numbers coaches pass on to players.
“You can’t give players a boatload of information and expect them to implement it out on the floor; it just doesn’t work that way,” Rambis said. “[But] let’s say that whenever your opponents take contested twos, their field-goal percentage is 25%, then you go, ‘Hey, this is what we want these guys to be doing. These are factual numbers.’”
Players are conflicted about the value of data — such as which players prefer to shoot after only two dribbles.
Said Clippers point guard Chris Paul: “If I just guard him and after two dribbles I stop and he takes a third and I say, ‘Hey, man, you’re only supposed to take two dribbles,’ then what? It’s cool, but you have to play.”
There’s also the geek-fatigue factor. Lakers center Chris Kaman said he was often overloaded with stats last season when he played for Dallas.
“It got a little bit annoying,” Kaman said, “hearing about it all the time — this number and that number, and every day the coach was talking about numbers.” Such as? “Points per possession, per second half, per first quarter, you know, this guy guarding this guy in this game or these five guys did good against these guys but not these guys,” he said. “There’s everything.”
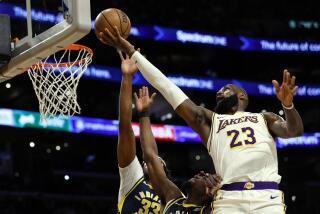
Including analytics related to injuries. The Lakers will be able to track Kobe Bryant’s accelerations and decelerations upon his return from a torn Achilles’ tendon, as well as how much load he’s putting on his legs during games. That information could help the team’s trainers implement practice plans that keep him spry the rest of the season.
Analytics can also show teams what players do that’s not reflected in the box score, information that could be used in contract negotiations.
Golden State coveted forward Carl Landry in free agency last year, Lacob said, despite what some might consider ho-hum conventional statistics. The metrics employed by the Warriors showed that Landry graded out well in situations they valued, including the way he scored and the types of rebounds he snagged.
“I think what you’re going to find,” said Brian Kopp, senior vice president of sports solutions for STATS, “is teams that say, ‘This is the type of player we’re looking for and I want to find the guy who’s on a $5-million contract instead of a $15-million contract that gets to 90% of that output.’ ”
Maheswaran, 39, and Chang, 35, hope more teams leave the number crunching to them.
The duo has worked together since 2005, eventually forming the Computational Behavior Group at USC. They have completed projects for the Department of Defense and the National Science Foundation involving the movement of vehicles, geo-tagged social media and mobile devices. “It’s great that we can transition from detecting enemy targets and tracking them to tracking our favorite players on the court,” Chang said.
Maheswaran and Chang won best paper at the MIT Sloan Sports Analytics Conference last year after pinpointing the relationship between the location of a shot and the odds of an offensive rebound: For every foot away from the basket that a player stands, the chance of an offensive rebound decreases by 1% until the three-point line, where it suddenly improves. They also determined that 90% of all missed shots can be rebounded within 11 feet of the basket.
The vibe in their downtown Los Angeles office can be more cheeky than geeky.
Programmers like to shatter the monotony of a coding shift by grabbing a volleyball and taking aim on a full-sized basketball goal that descends from the massive windows. This invariably leads to shouts of “Duck!” and “Look out!” when an errant shot threatens an unsuspecting co-worker’s desk.
It’s probably a good thing Maheswaran and Chang haven’t compiled analytics for their employees.
Then again, it’s still early in this game.
Twitter: @latbbolch
More to Read
Get our high school sports newsletter
Prep Rally is devoted to the SoCal high school sports experience, bringing you scores, stories and a behind-the-scenes look at what makes prep sports so popular.
You may occasionally receive promotional content from the Los Angeles Times.
