

This year California's snowpack reached record-high levels — 40 million acre-feet at its peak in April.
Melted, that would be enough to hypothetically drape almost 5 inches of water across the entire state of California.
In terms of volume, that's equivalent to a third of Lake Tahoe at full capacity.
Where will all that water go?
“The ‘big melt’ is on the way.”
That was UCLA climate scientist Daniel Swain’s warning to Californians in late March, days before officials announced that this year’s Sierra snowpack contained historic volumes of water.
After years of drought and restrictions on water use, a series of atmospheric rivers between January and March brought epic amounts of rain and snow to the parched state. Heavy precipitation and below-average temperatures meant that snow accumulated for months high in the Sierra Nevada mountains along California's eastern border.
At its peak, the snowpack contained nearly as much as the total capacity of all the state’s reservoirs combined, according to airborne measurements.
The snowpack itself acts as a natural water storage system for California. When the region’s climate shifts from cold and wet to warm and dry, the snow gradually melts down from mountain rivers and creeks, filling reservoirs and, possibly, causing further flooding in the Central Valley’s once-dry Tulare Lake.
State water managers say the snowmelt has likely peaked for the season, so long as temperatures remain relatively cool. Another rise in the melt is expected next week.
A drought-busting winter
California’s “wet” season runs from October to the end of March. That is when much of the state’s rain and especially snow arrives. This year, the storms kept coming.
Coupled with below-average temperatures, particularly in the Sierra, all that snow was able to pile up.
An enormous snowpack
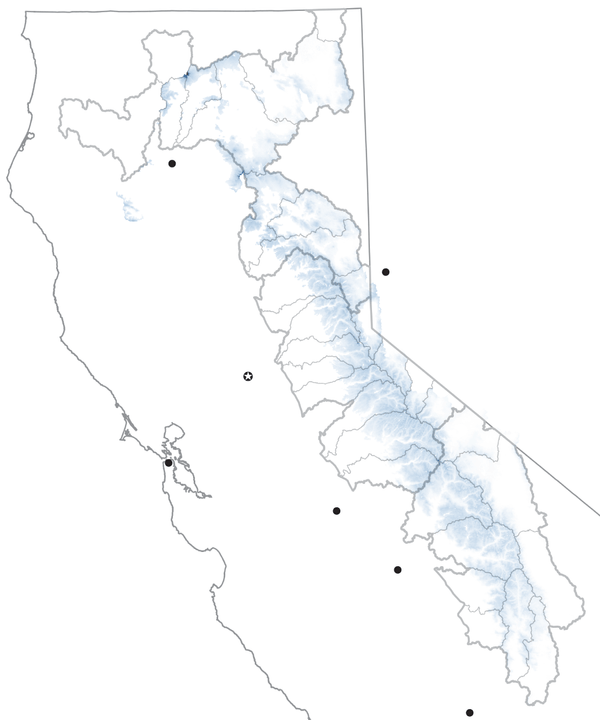
The Sierra snowpack typically reaches its maximum depth around April 1, when the region’s climate shifts from the wet to dry season. The snowpack plays a critical role in water storage for the state. Water remains frozen in the mountains until warming spring and summer temperatures gradually release it.
This year’s snowpack reached 240% of the April average, a level not seen since the 1980s, when the state’s electronic monitoring system came online.
Snow water equivalent (in inches)

0
35
44
77
59
Average, 2000-2021

Redding
Reno
Sacramento
San Francisco
Merced
Fresno
Bakersfield
April 1, 2023
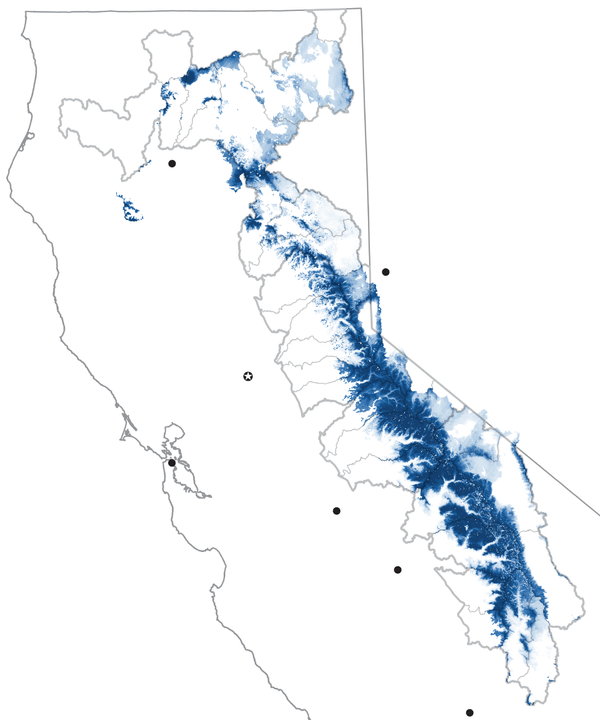
Redding
Reno
Sacramento
San Francisco
Merced
Fresno
Bakersfield
Average is a modeled estimate for years 2000-2021.
As of June 7, the snowpack stands at 300% of normal for this time, according to California Department of Water Resources data.
In terms of volume, state officials estimate the snowpack still contains about 9.6 million acre-feet of water. But that does not mean all of it will make its way into state reservoirs. Some of it will be absorbed into the groundwater or by plants. Some will evaporate or sublimate.
Nowhere to go but downhill
As the snow melts in the spring and early summer, the runoff drains down the mountains through the state’s many watersheds and rivers. Much of that water is captured by California’s system of reservoirs, the largest of which are located in the north.
DWR calculates the volume of water that would flow through these watersheds if there were no dams, cities or farms capturing or diverting the water. This metric, sometimes called “natural flow,” takes into account a river basin’s precipitation patterns, snowpack and reservoir levels to assess how much water a river basin is producing.
“There is a lot of snow up there in various areas, so these watersheds are going to be flowing high for quite some time,” said Sean de Guzman, DWR’s manager of snow surveys.
The forecasts are used by reservoir operators to plan for incoming snowmelt. If a large volume of snowmelt is projected to come down, managers may release water from the dam to make room and avoid potential spillover. For that reason, the forecast may not be a one-to-one comparison to actual river and stream conditions.
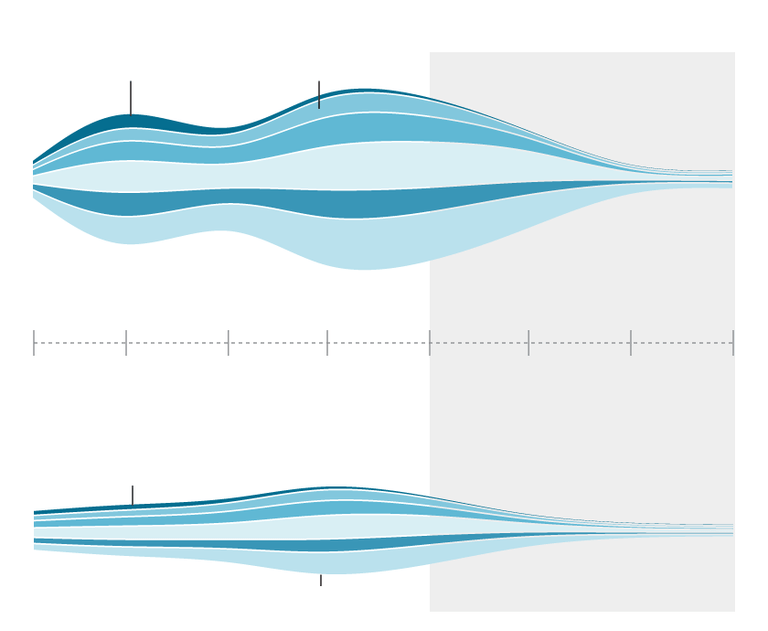
This spring, the Sacramento River hydrologic region saw an immediate peak in runoff due to the massive volumes of rain. Because the area is much lower in elevation than other watersheds, much of its water comes from rain rather than snow. Hydrologic regions are essentially drainage basins, contained by the state’s mountain ranges and consisting of a number of watersheds and rivers.
Natural flow in the Sacramento River
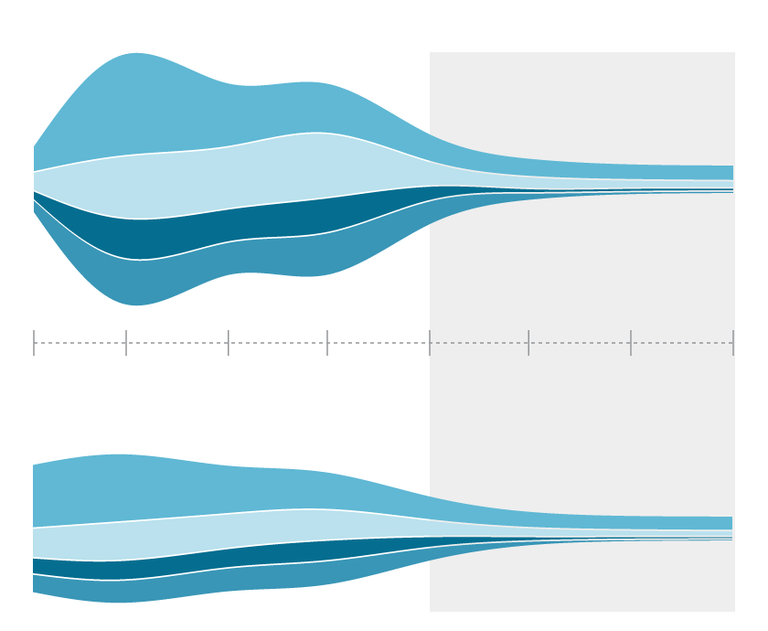
2023
Sacramento
Feather
Yuba
American
Feb.
March
April
May
June
July
Aug.
Sept.
Average, 1991–2020
Sacramento
Feather
2023
Sacramento
Feather
Yuba
American
Feb.
March
April
May
June
July
Aug.
Sept.
Average, 1991–2020
Sacramento
Feather
Yuba
American
Flows for June through September are forecasts.
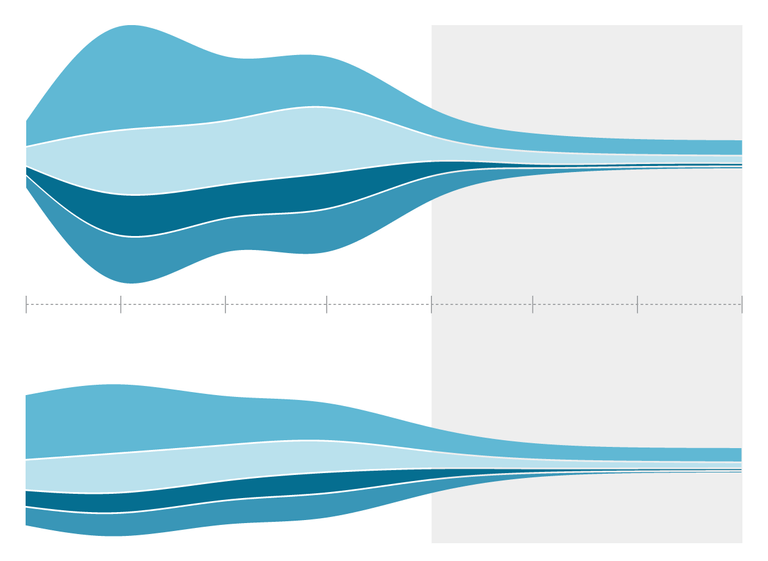
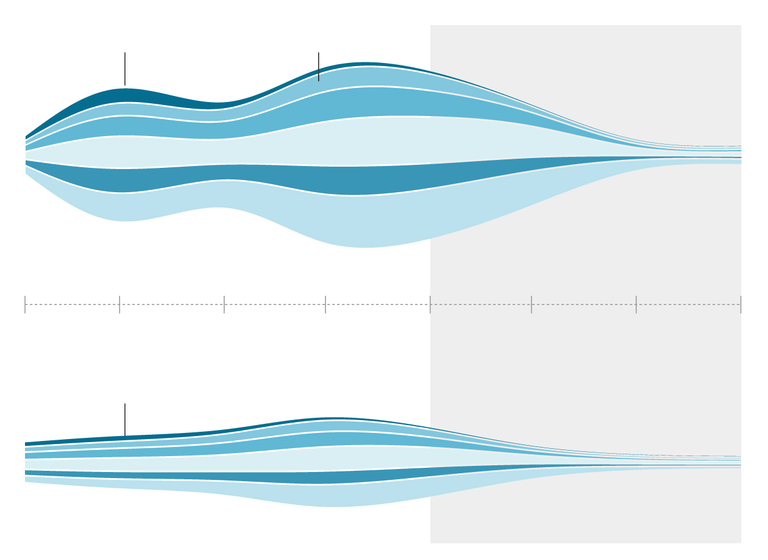
Most of the remaining snow is further south in the San Joaquin and Tulare Lake hydrologic regions, de Guzman said.
Those regions typically see a much later peak in runoff because they are higher in elevation and, therefore, can store much more water in their snowpacks.
“It’s sort of like a slow-moving train. It’s going to keep coming,” de Guzman said.
In June, officials expect nearly as much or more snowmelt than in May in many of the major watersheds in the San Joaquin and Tulare Lake regions, de Guzman said.
For example, the state forecasts 1 million acre-feet of natural flow through the San Joaquin watershed, which drains into Millerton Lake north of Fresno.
“Lake Millerton essentially will have to fill and spill twice during the month of June,” de Guzman said.
Natural flow in the San Joaquin River
2023
Cosumnes
Mokelumne
Stanislaus
Tuolumne
Merced
San Joaquin
Feb.
March
April
May
June
July
Aug.
Sept.
Average, 1991–2020
Cosumnes
San Joaquin
2023
Cosumnes
Mokelumne
Stanislaus
Tuolumne
Merced
San Joaquin
Feb.
March
April
May
June
July
Aug.
Sept.
Average, 1991–2020
Cosumnes
Tuolumne
San Joaquin
The most pronounced impact of this winter’s storms and snowpack has been on the Tulare Lake region. Compared with the average year, a significant volume of water accumulated in the Kings and Kern river watersheds. About 2.6 million acre-feet of water remains contained in snow.
Natural flow in the Tulare Lake
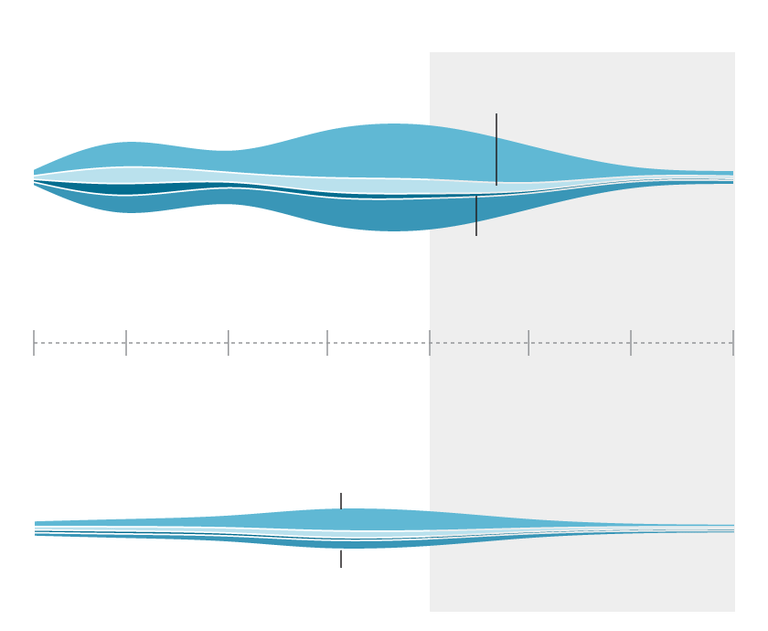
2023
Kaweah
Kings
Kern
Tule
Feb.
March
April
May
June
July
Aug.
Sept.
Average, 1991–2020
Kings
Kern
2023
Kaweah
Kings
Kern
Tule
Feb.
March
April
May
June
July
Aug.
Sept.
Average, 1991–2020
Kings
Kern
Forecast: flooding
While most of California’s rivers drain in the ocean, those in the Tulare Lake region do not.
This winter’s incessant rains filled much of the state’s depleted reservoirs but also inundated a massive area just west of Corcoran. The lakebed, drained of water a century ago to make room for agricultural fields, reemerged during this year’s storms.

Feb. 9

March 13

April 6

April 30

May 8

May 24
State officials believe flooding in the region has largely peaked due to continued cool temperatures in the mountains.
At the end of last month, about 110,000 acres of land in Tulare Lake were flooded, an area larger than the city of Bakersfield. That translates to about 580,000 acre-feet of water.
State models indicate the lake could expand another thousand acres. In a lower probability, wet scenario that number could rise to 118,000 acres.
The land near Corcoran is made up of dense clay, making it hard for standing water to be absorbed into the ground. The area could remain flooded for years.
“Flood risks are always present, even on sunny days in the middle of summer,” de Guzman said. “Rivers will be running high and fast throughout the summer, so impacts especially in the San Joaquin Valley are still present.”