The rise of the
Indian American candidate
How Kamala Harris and a new generation are changing the face of politics
In 1956, Dalip Singh Saund became the first Indian American elected to Congress.
1956
’58
He held a seat representing parts of Riverside and Imperial counties for three terms.
’60
’62
’64
’66
’68
’70
’72
’74
It's unclear how many others ran before 1976. That's when government data starts to track Indian American candidates for federal office...
’76
’78
’80
’82
’84
’86
’88
’90
... with none elected ...
’92
’94
’96
’98
2000
’02
... until Bobby Jindal won a U.S. House seat representing Louisiana in 2004.
’04
’05
’06
’08
’10
’12
’14
Twelve years later, Kamala Harris was the first person of Indian heritage to join the Senate.
’16
TTTTTTTTTTTTTTTTTTTTTTTTTTTTTTTTTTTTTTTTTTTTTTTTTTTTTTTTTTTTTTTTTTTTTTTTTT
TTTTTTTTTTTTTTTTTTTTTTTTTTTTTTTTTTTTTTTTTTTTTTTTTTTTTTTTTTTTTTTTTTTTTTTTTT
TTTTTTTTTTTTTTTTTTTTTTTTTTTTTTTTTTTTTTTTTTTTTTTTTTTTTTTTTTTTTTTTTTTTTTTTTT
TTTTTTTTTTTTTTTTTTTTTTTTTTTTTTTTTTTTTTTTTTTTTTTTTTTTTTTTTTTTTTTTTTTTTTTTTT
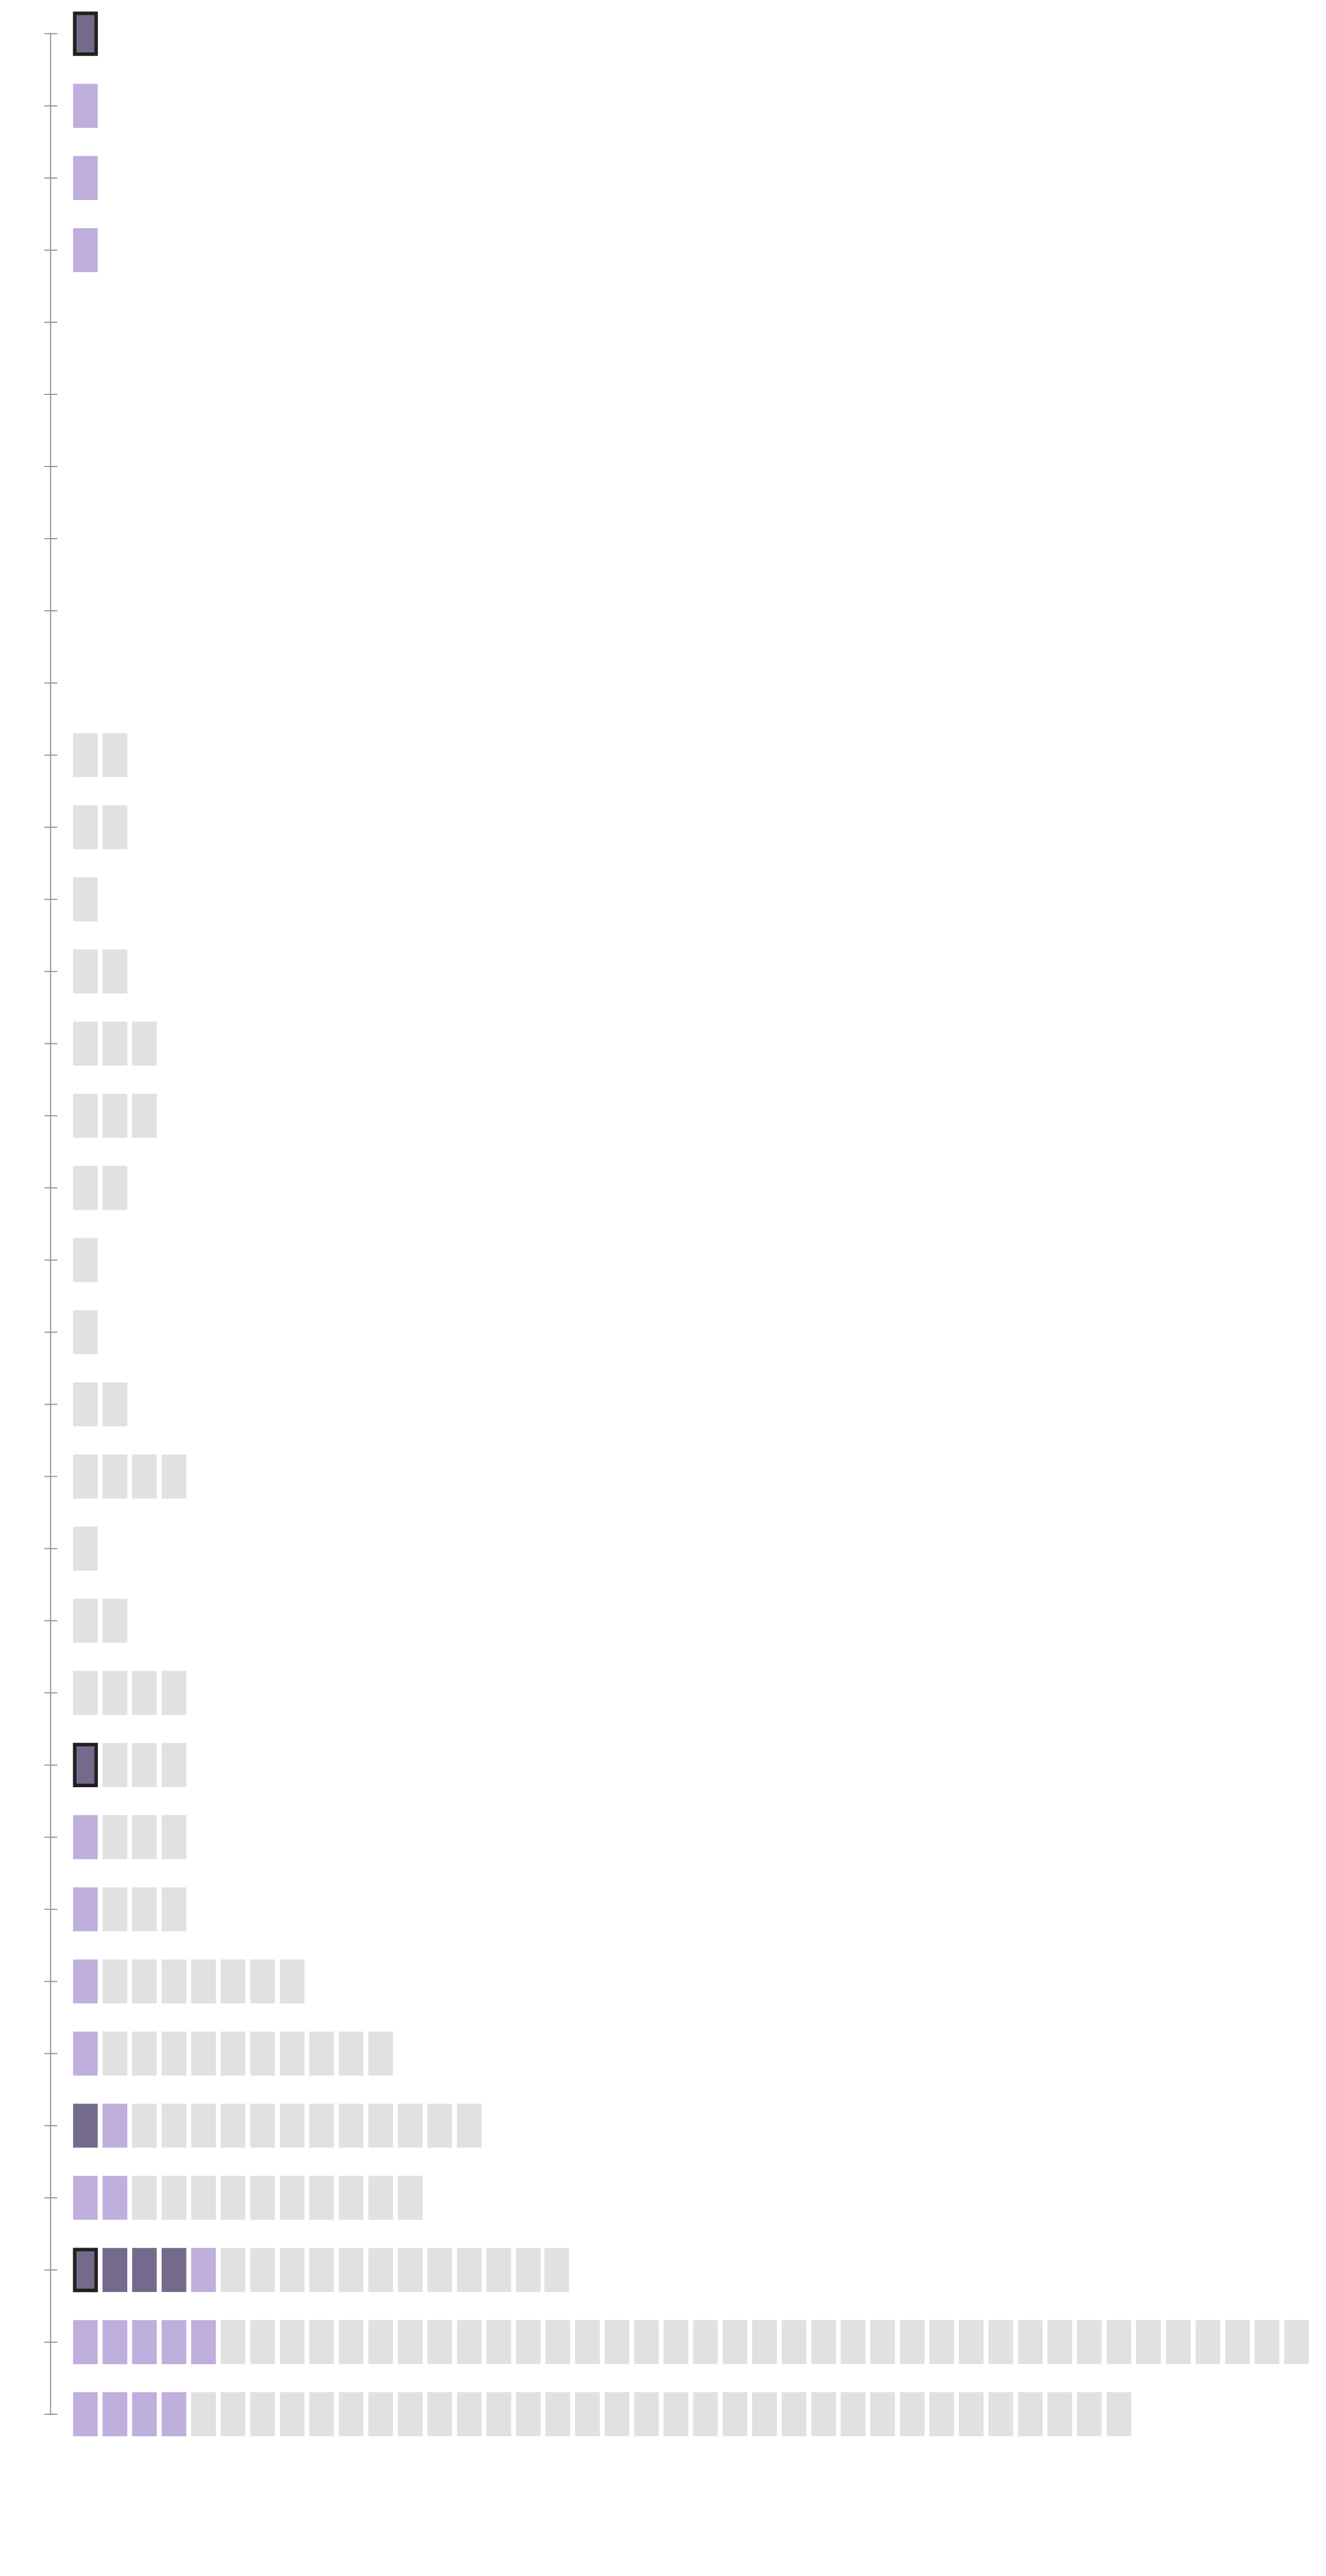
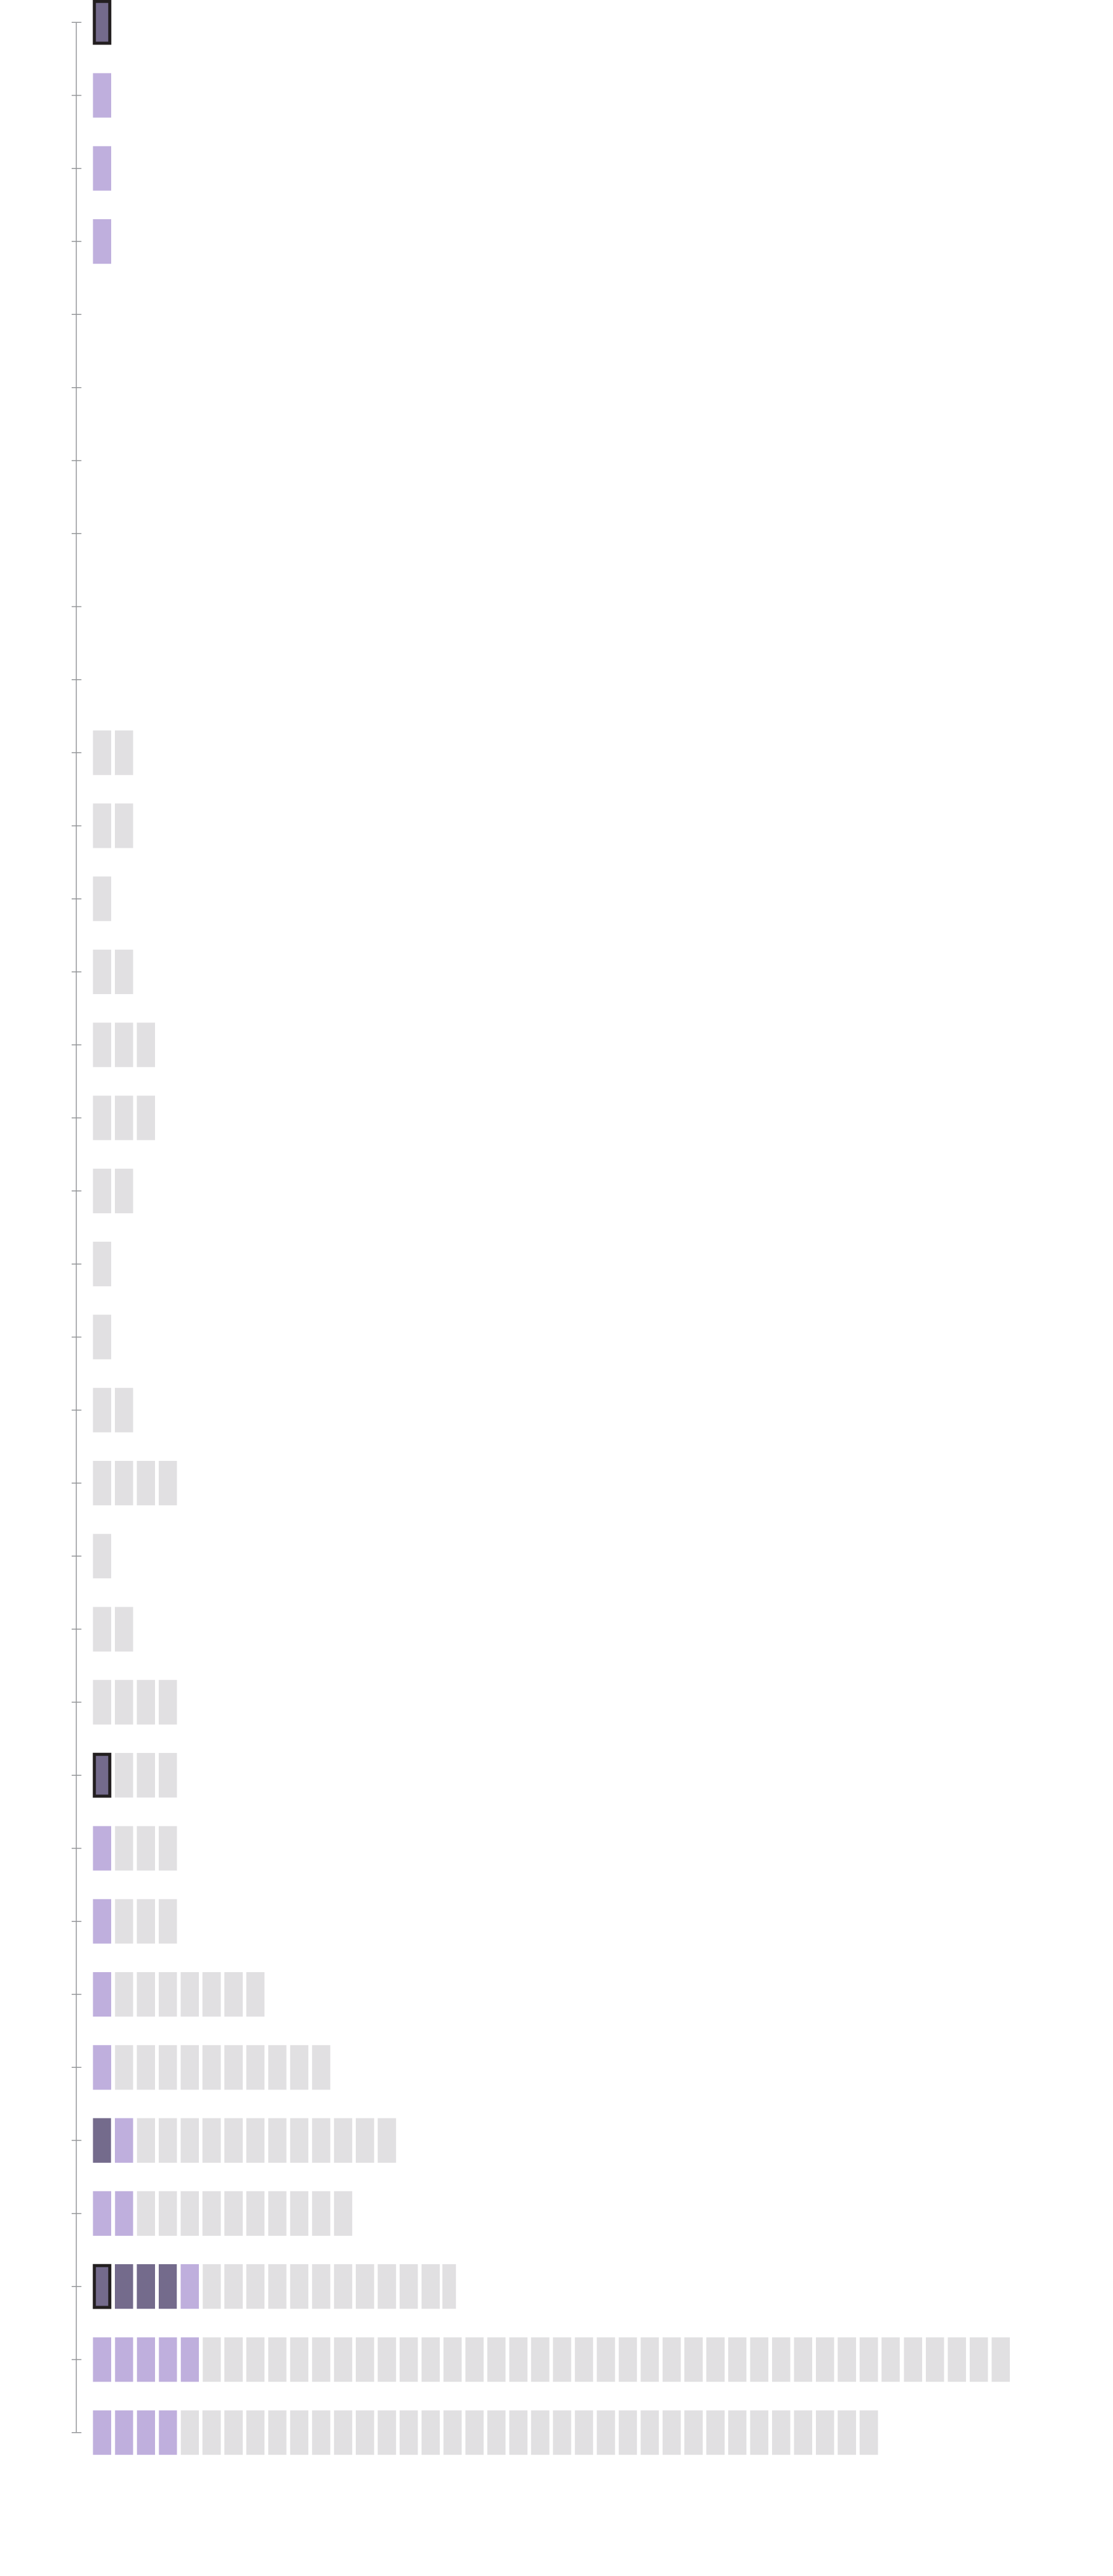
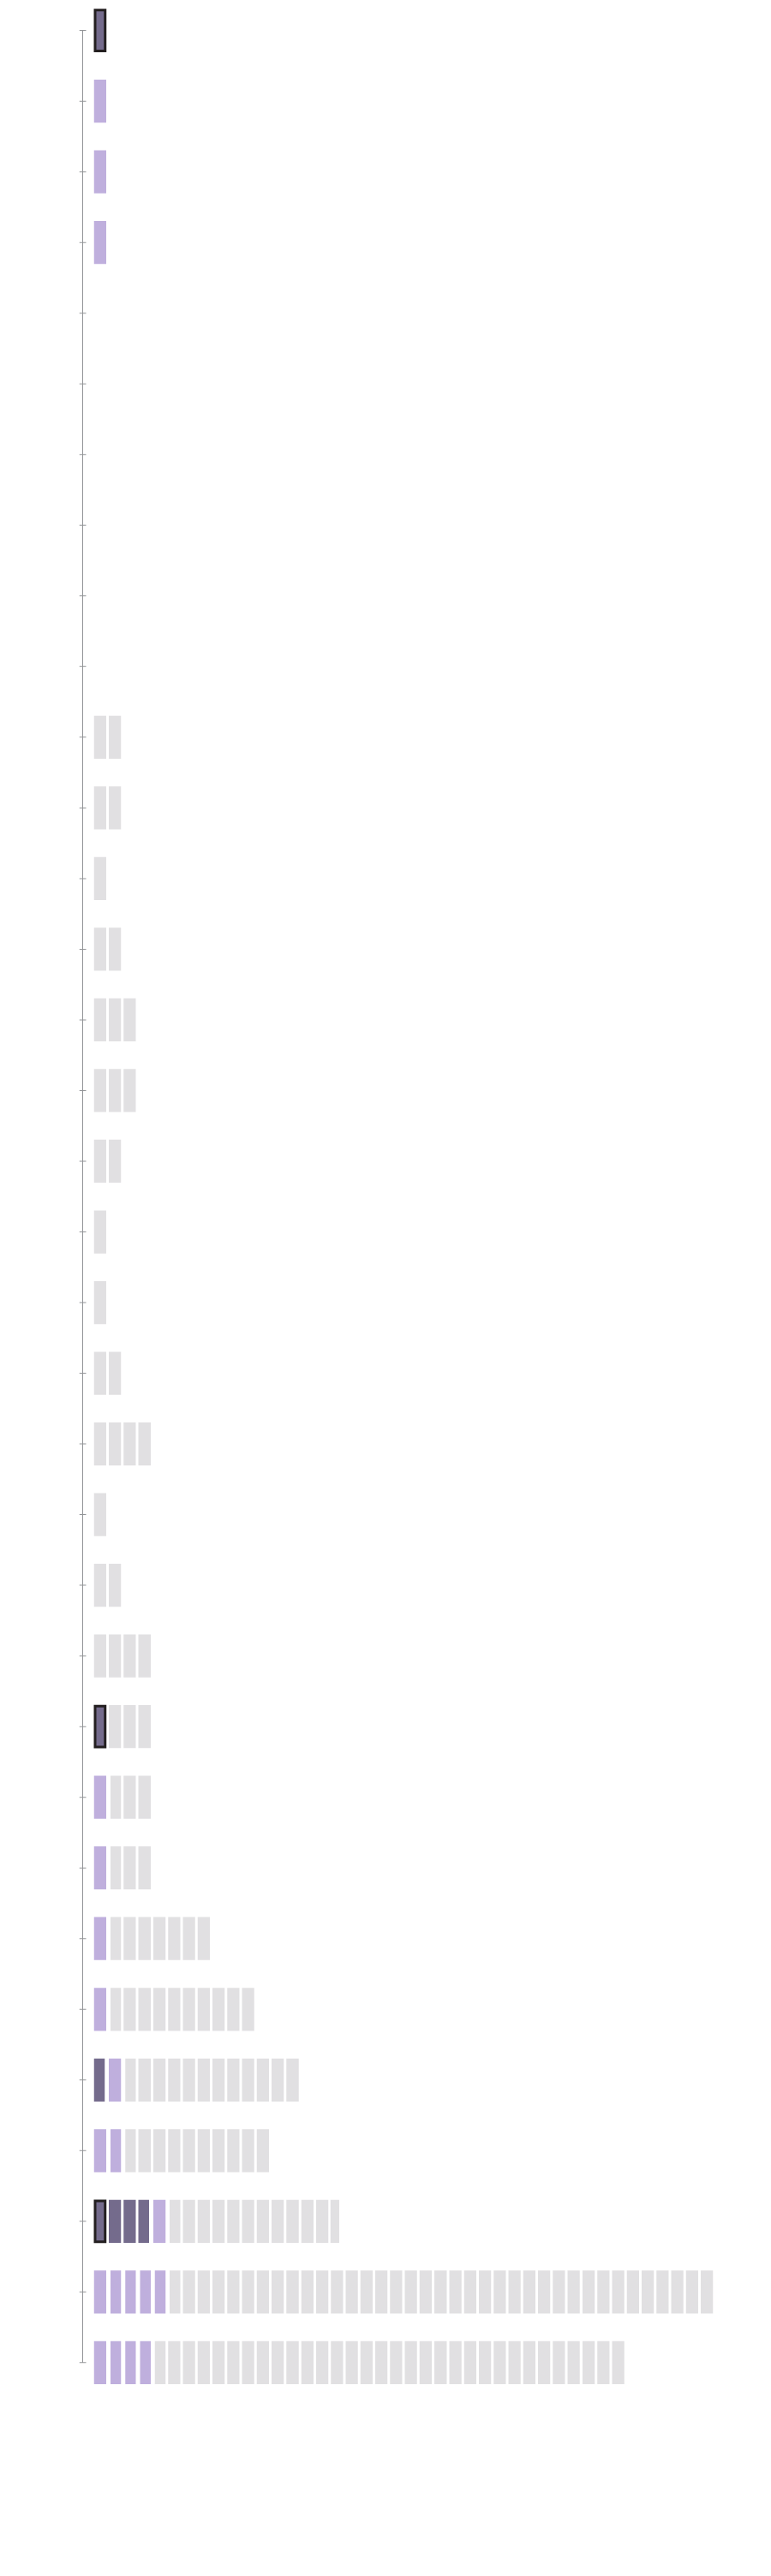
Since then, 77 Indian American candidates have run for Congress, a new record.
’18
In 1956, Dalip Singh Saund became the first Indian American politician elected to Congress.
1956
’58
He held a seat representing parts of Riverside and Imperial counties for three terms.
’60
’62
’64
’66
’68
’70
’72
’74
It's unclear how many others ran before 1976. That's when government data starts to track Indian American candidates for federal office...
’76
’78
’80
’82
’84
’86
’88
’90
... with none elected ...
’92
’94
’96
’98
2000
’02
... until Bobby Jindal won a U.S. House seat representing Louisiana in 2004.
’04
’05
’06
’08
’10
’12
’14
Twelve years later, Kamala Harris was the first person of Indian heritage to join the Senate.
’16
TTTTTTTTTTTTTTTTTTTTTTTTTTTTTTTTTTTTTTTTTTTTTTTTTTTTTTTTTTTT
TTTTTTTTTTTTTTTTTTTTTTTTTTTTTTTTTTTTTTTTTTTTTTTTTTTTTTTTTTTT
TTTTTTTTTTTTTTTTTTTTTTTTTTTTTTTTTTTTTTTTTTTTTTTTTTTTTTTTTTTT
Since then, 77 Indian American candidates have run for Congress, a new record.
’18
In 1956, Dalip Singh Saund became the first Indian American politician elected into the U.S. Congress.
1956
’58
’60
He held a seat representing parts of Riverside and Imperial counties for three terms.
’62
’64
’66
’68
’70
’72
’74
It's unclear how many others ran before 1976. That's when government data starts to track Indian American candidates for federal office...
’76
’78
’80
’82
’84
’86
’88
’90
... with none elected ...
’92
’94
’96
’98
2000
’02
... until Bobby Jindal won a U.S. House seat representing Louisiana in 2004.
’04
’05
’06
’08
’10
Twelve years later, Kamala Harris was the first person of Indian heritage to join the Senate.
’12
’14
’16
TTTTTTTTTTTTTTTTTTTTTTTTTTTTTTTTTTTTTTTTTTTTTTTTTTTTTTTTTTTTTTTTTTTTTTTT
TTTTTTTTTTTTTTTTTTTTTTTTTTTTTTTTTTTTTTTTTTTTTTTTTTTTTTTTTTTTTTTTTTTTTTTT
Since the, 77 Indian American politicians have run for Congress, a new record.
’18
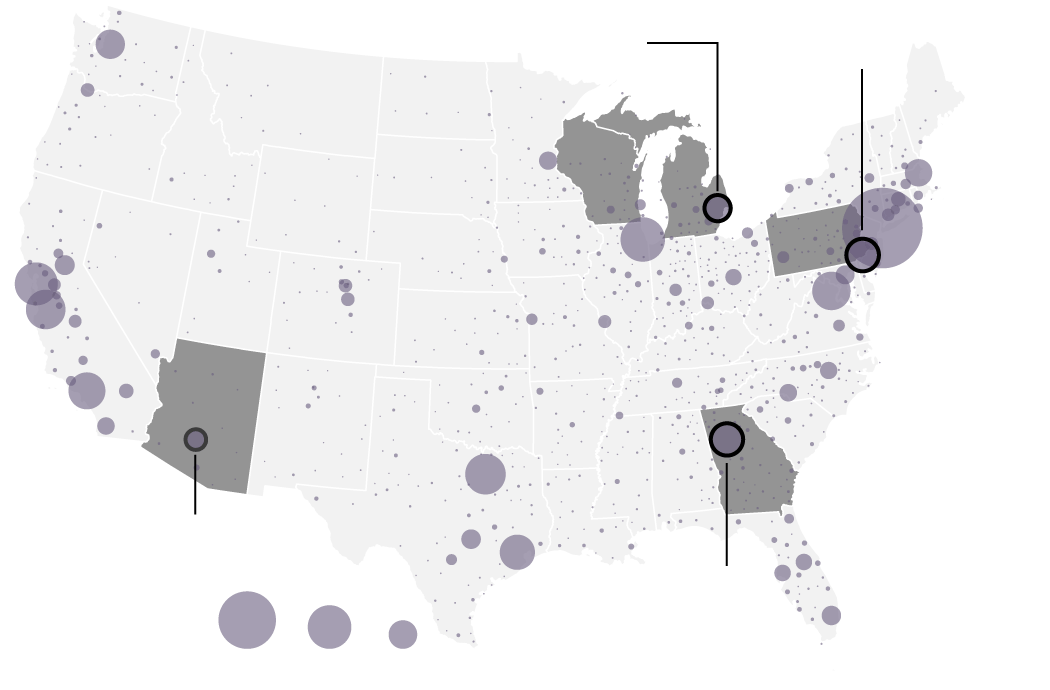
In a sign of the group's growing sway, more Indian Americans than ever are running for Congress.
In the last six years, nearly 80 candidates made it on the ballot, soaring far beyond numbers seen in past elections. Leading the wave are successful candidates from California, like Kamala Harris, who rose from a Senate seat to become vice president.
Thanks to a long-standing immigration pipeline to the U.S., Indian Americans have become one of the country's fastest growing ethnic groups. Their numbers have increased five times over since the 1990s and make up 1.3% of the U.S. population.
No state has more than California, which is home to more than 800,000 people of Indian descent. Voters in the state have elected four Indian Americans to the U.S. House and Senate, more than all other states combined.
Unlike other Asian groups that are mostly concentrated on the West Coast, Indian Americans have increasingly spread out across the country. As their numbers grow, their political power is strengthening and more Indians are appearing on the ballot in the Midwest and the South.
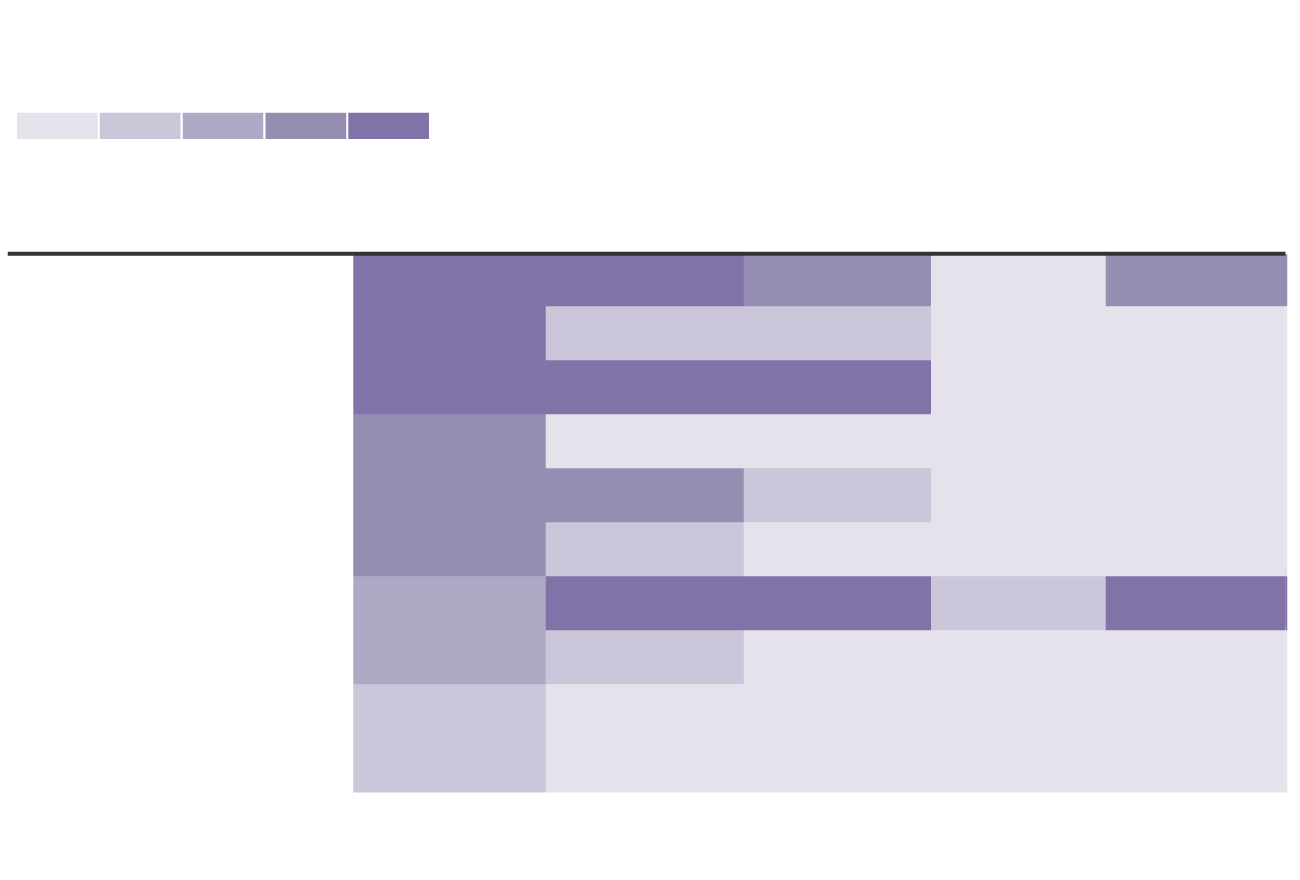
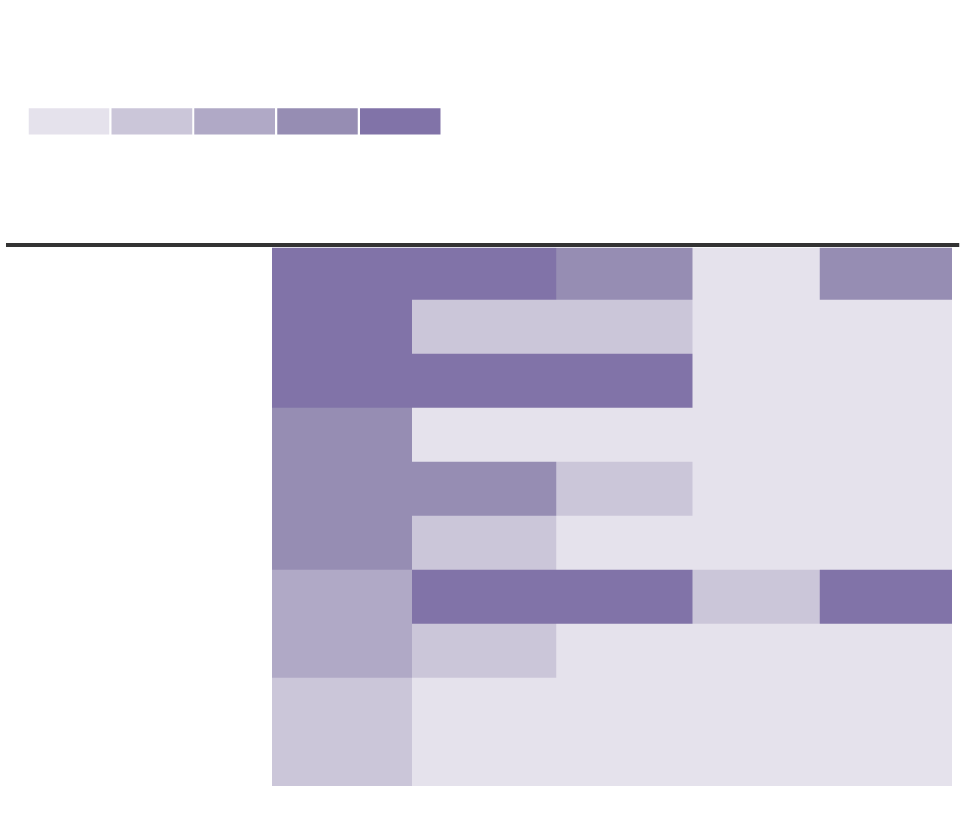
Top 10 U.S. metro areas by Indian American Population
Residents
0
50k
100k
150k
200k
250k+
Metro area
Indian
Chinese
Filipino
Japanese
Korean
645,484
761,762
1
New York
195,552
42,233
197,930
2
Chicago
221,908
113,772
115,546
16,579
51,320
499,233
209,000
248,922
40,322
47,709
3
San Francisco
4
Dallas
187,782
59,819
34,165
7,100
30,769
5
San Jose
179,864
189,143
92,015
26,410
30,299
170,518
109,415
66,772
12,565
81,062
6
Washington, D.C.
7
Los Angeles
158,649
550,502
424,428
132,094
303,012
8
Houston
94,187
51,615
6,210
16,242
145,288
9
Philadelphia
127,587
84,789
26,793
3,863
33,017
10
Atlanta
125,724
48,684
13,736
7,024
45,644
U.S. Census Bureau
LOS ANGELES TIMES
Top 10 U.S. metro areas by Indian American Population
Residents
0
50k
100k
150k
200k
250k+
Metro area
Indian
Chinese
Filipino
Japanese
Korean
1
New York
195,552
645,484
761,762
42,233
197,930
221,908
113,772
2
Chicago
115,546
16,579
51,320
209,000
248,922
40,322
47,709
3
San Francisco
499,233
4
Dallas
187,782
59,819
34,165
7,100
30,769
5
San Jose
179,864
189,143
92,015
26,410
30,299
6
Washington, D.C.
170,518
109,415
66,772
12,565
81,062
7
Los Angeles
550,502
424,428
158,649
132,094
303,012
8
Houston
145,288
94,187
51,615
6,210
16,242
9
Philadelphia
127,587
84,789
26,793
3,863
33,017
10
Atlanta
125,724
48,684
13,736
7,024
45,644
U.S. Census Bureau
LOS ANGELES TIMES

Top 10 U.S. metro areas
by Indian American Population
Residents
0
50k
100k
150k
200k
250k+
Japanese
Chinese
Filipino
Korean
Indian
Metro area
645k
761k
195k
42k
197k
New York
221k
113k
115k
16k
51k
Chicago
San
209k
499k
248k
40k
47k
Francisco
187k
59k
34k
7k
30k
Dallas
179k
189k
92k
26k
30k
San Jose
Washington,
170k
109k
66k
12k
81k
D.C.
158k
550k
424k
132k
303k
Los Angeles
145k
94k
51k
6k
16k
Houston
127k
84k
26k
3k
33k
Philadelphia
125k
48k
13k
7k
45k
Atlanta
U.S. Census Bureau
LOS ANGELES TIMES
"We have roots in almost every part of this country," said Rep. Ro Khanna, a Democrat elected to represent parts of the Bay Area in 2016.
Khanna, a son of immigrants who grew up in the Philadelphia suburbs, said Indians can be found all across the country in part due to professionals in medicine, education and technology moving to areas where their skills are in high demand.
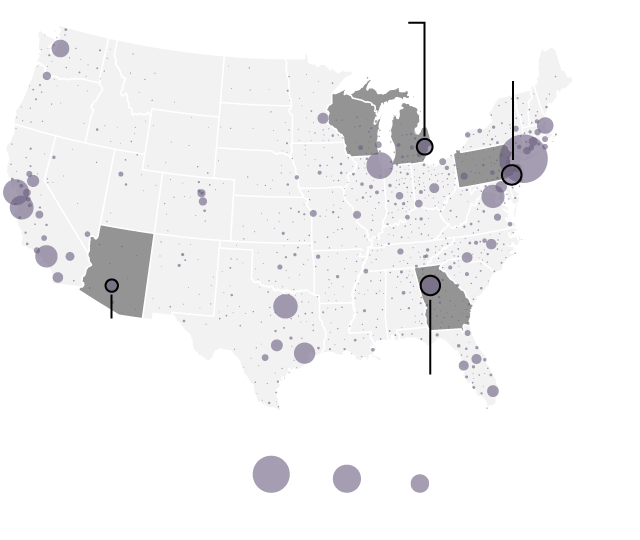
The result is that many Indian Americans live in swing states where their vote may be vital in a closely contested election. Sara Sadhwani, an assistant professor of politics at Pomona College, points to races like last year's crucial elections in Georgia, where President Biden and two Democratic Senate candidates narrowly won. High turnout in the Atlanta area was key to the victory. The area is home to more than 125,000 Indian Americans who lean Democratic and Sadhwani says contributed to the party's victory.
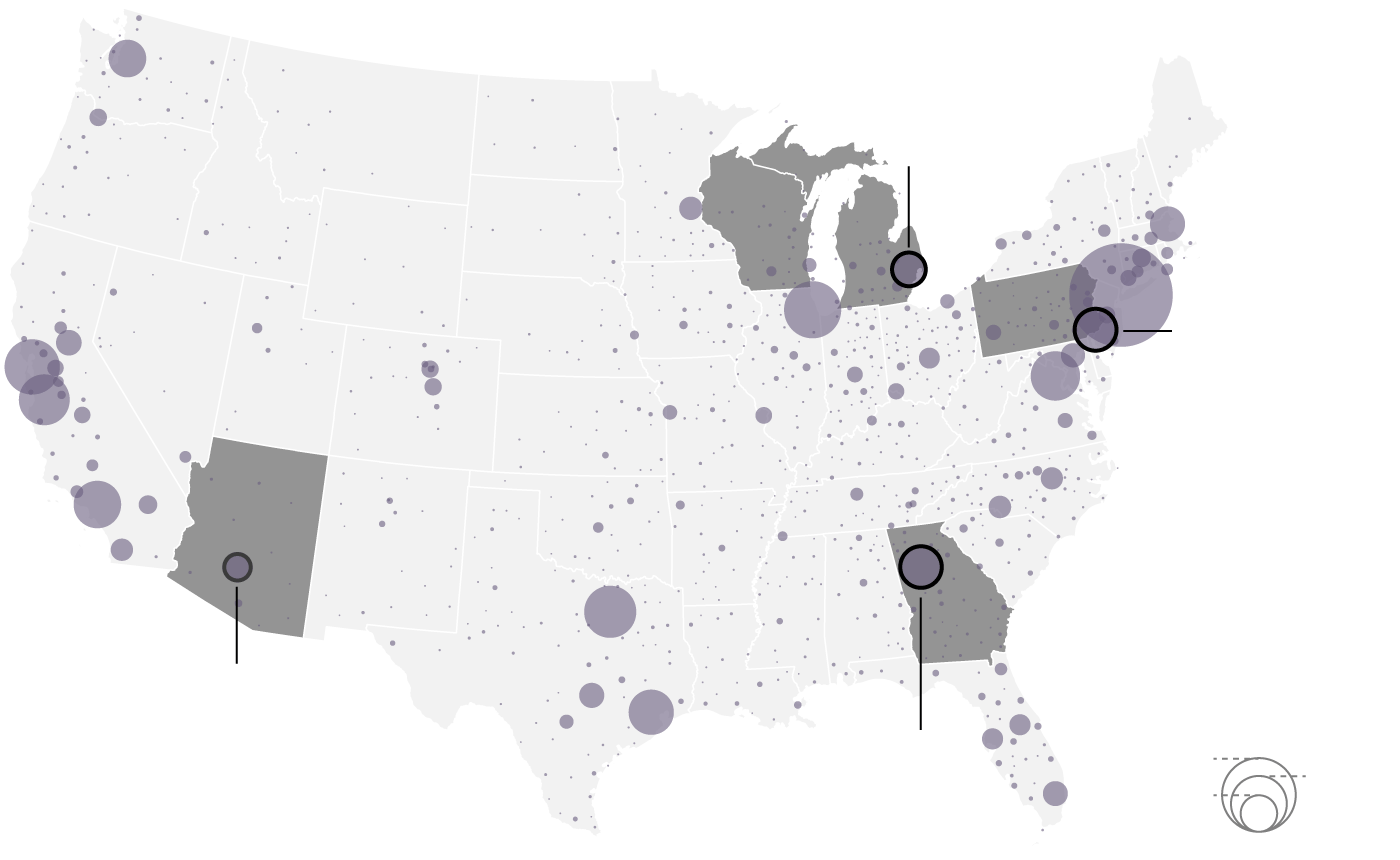
There are many Indian Americans across the country, including in states that flipped from Trump to Biden in 2020.
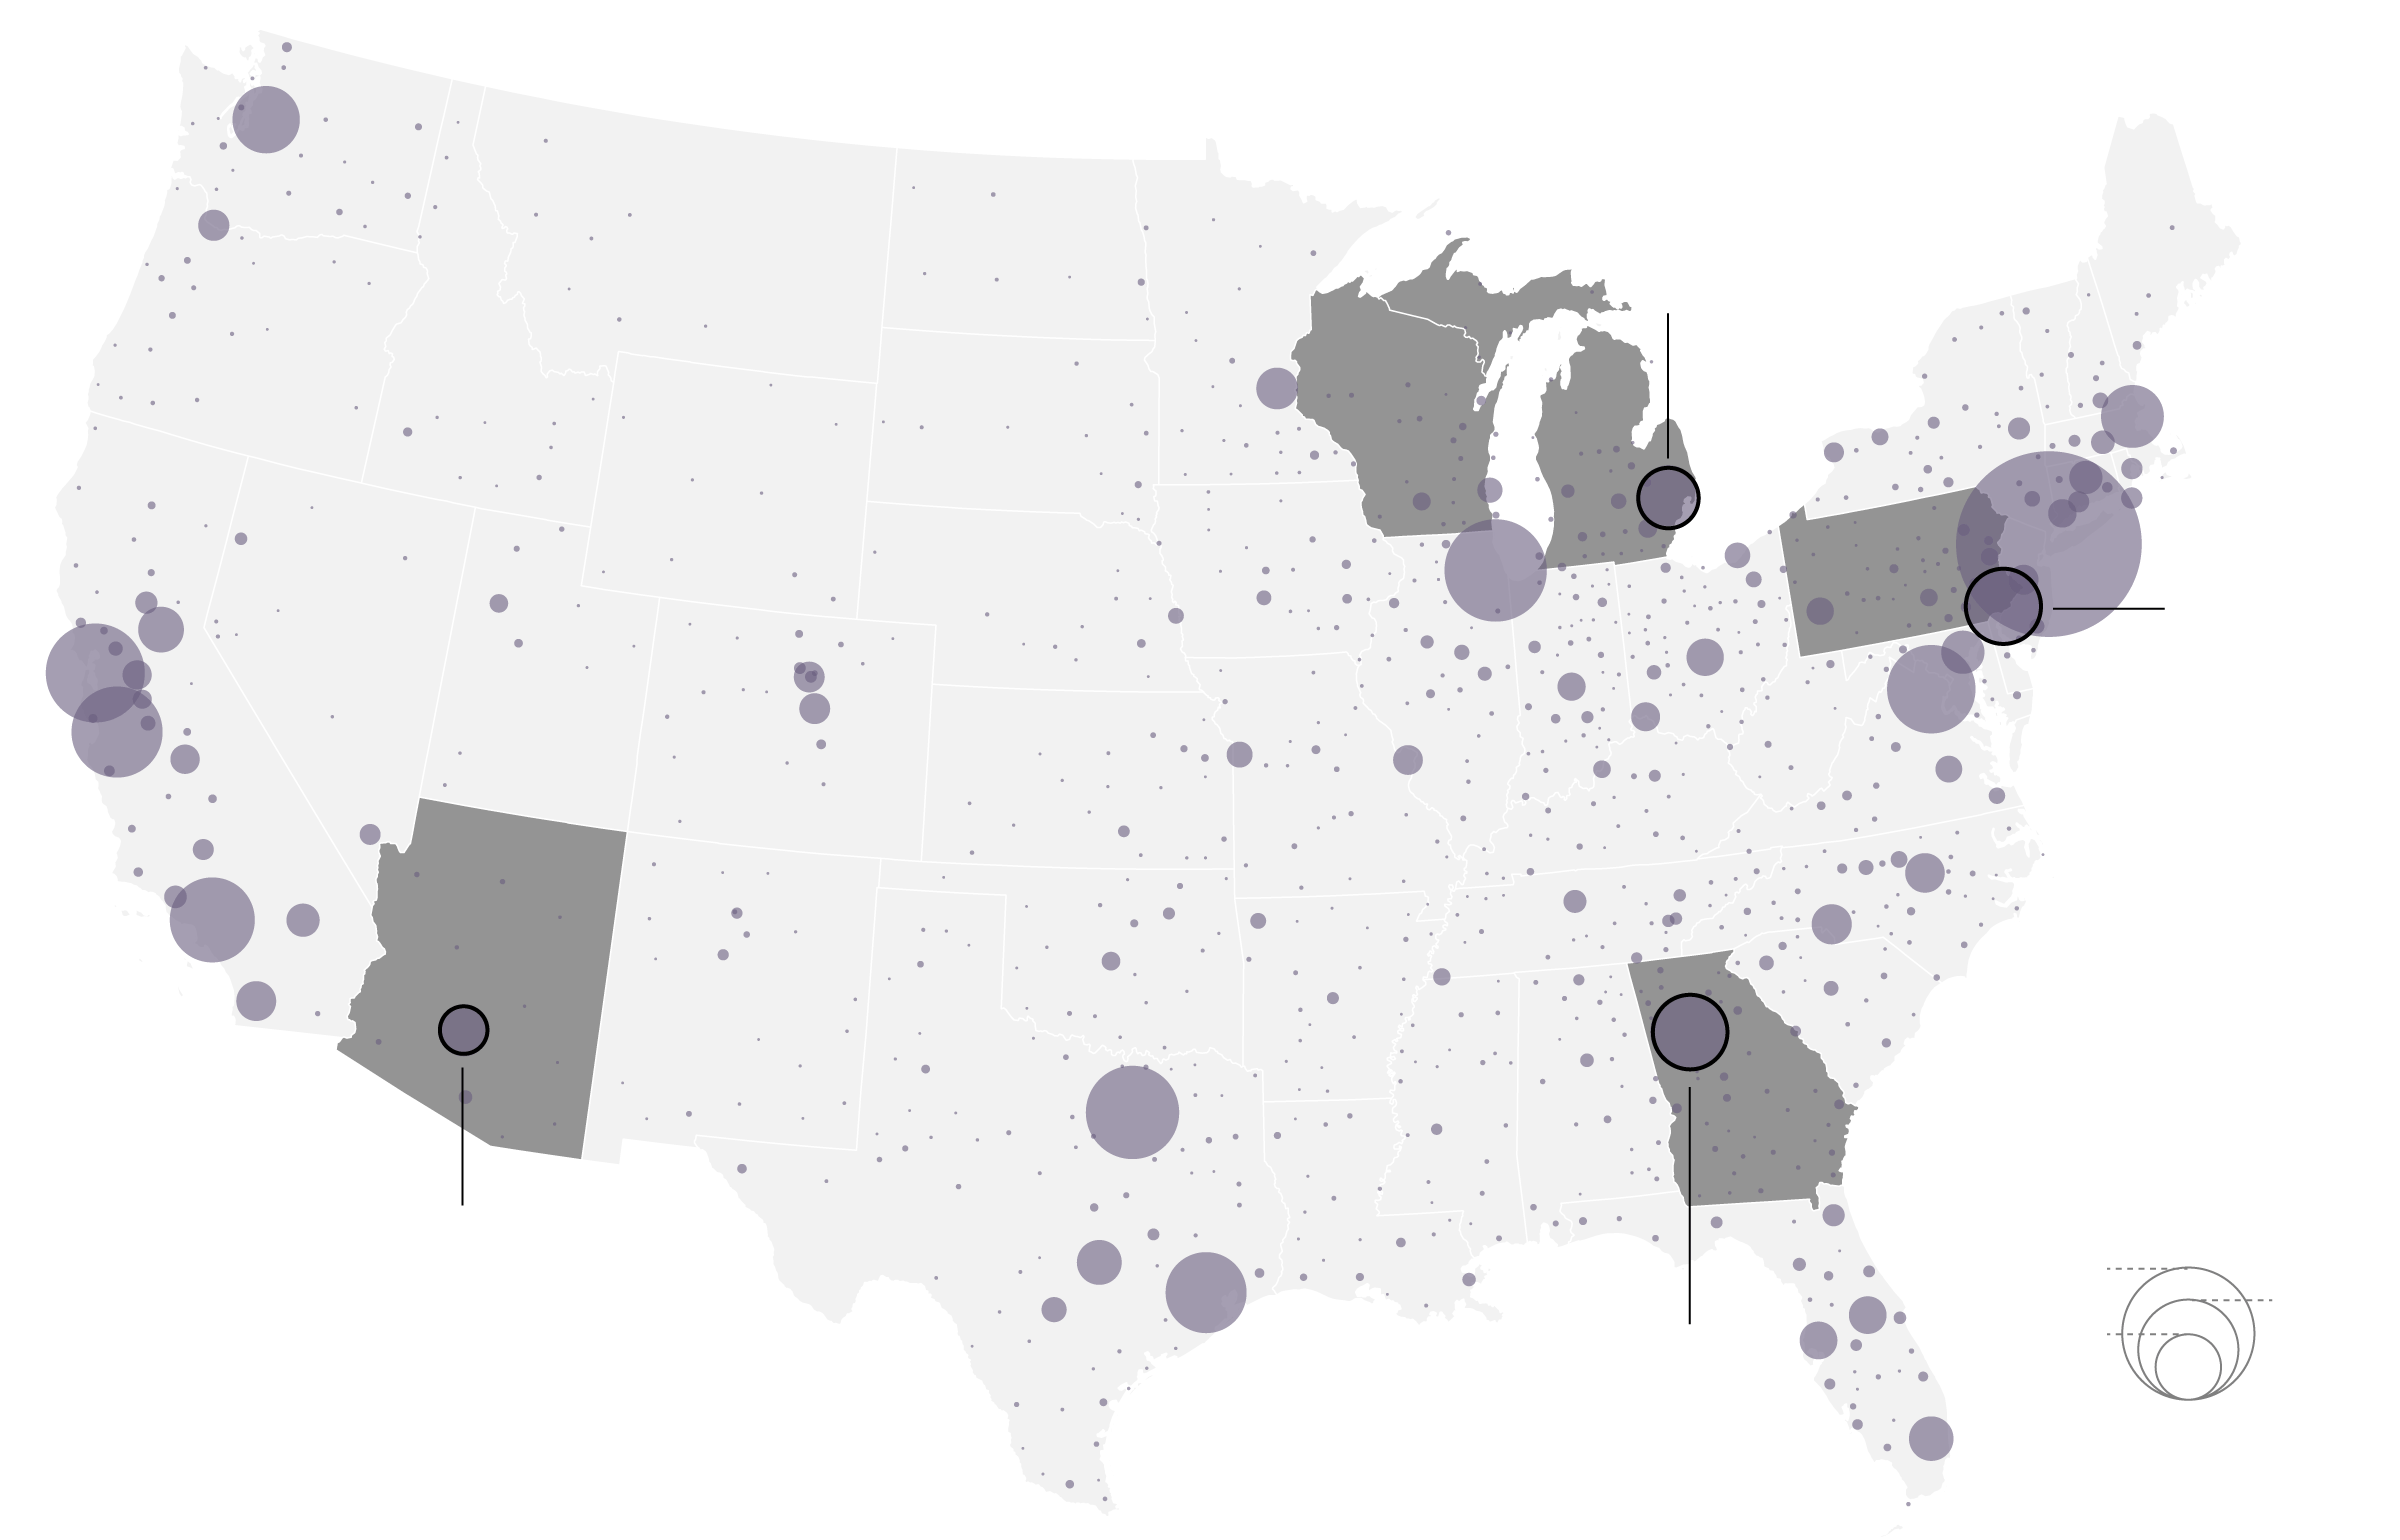
Detroit, MI
85,663
Wis.
Philadelphia, PA
127,587
Population by
Metropolitan area
Phoenix, AZ
55,004
500k
250k
100k
Atlanta, GA
125,724
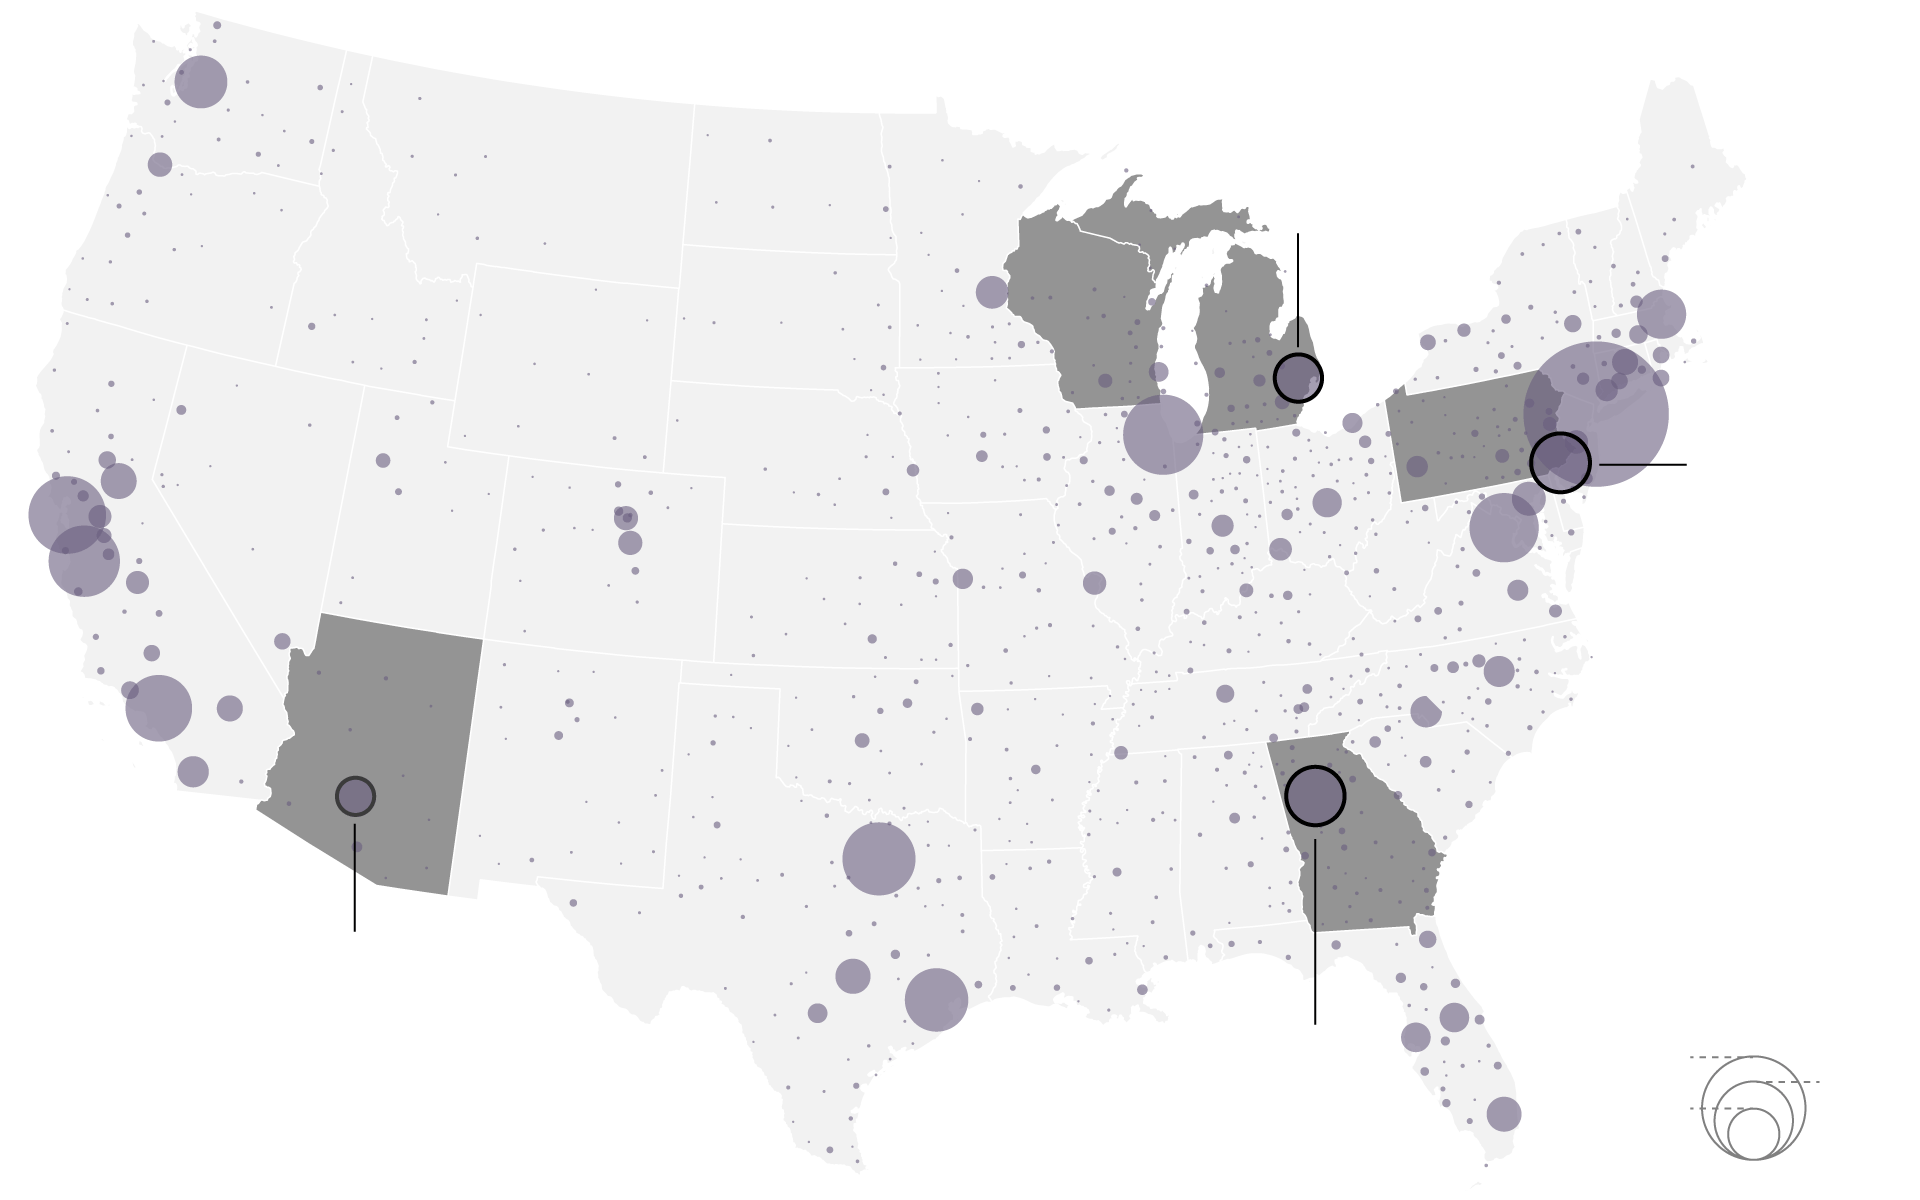
Detroit, MI
85,663
Wis.
Philadelphia, PA
127,587
Phoenix, AZ
55,004
Population by
Metropolitan area
Atlanta, GA
125,724
500k
250k
100k
Detroit, MI
85,663
Wis.
Philadelphia, PA
127,587
Population by
Metropolitan area
Phoenix, AZ
55,004
500k
Atlanta, GA
125,724
250k
100k
Philadelphia, PA
127,587
Detroit, MI
85,663
Wis.
Phoenix, AZ
55,004
Atlanta, GA
125,724
Population by
Metropolitan area
250k
100k
500k
Detroit, MI
85,663
Philadelphia, PA
127,587
Phoenix, AZ
55,004
Atlanta, GA
125,724
Population by
Metropolitan area
500k
250k
100k
A second generation inspired to step up
Former President Obama was key to advancing the careers of Khanna and fellow California Rep. Ami Bera, an Indian American who represents parts of Sacramento.
Both were inspired to change careers and run for Congress after Obama became the first person of color elected president.
Bera, a practicing physician, said a desire to join Obama in reforming the healthcare system led him to seek office. It wasn't until he was elected, he said, that he realized he would be the only Indian American in the House and committed to helping others with a similar background get elected.
That would require convincing other Indian American professionals to consider a career change to get involved in politics.
"This isn't about becoming an engineer or a doctor," said Bera. "It's also about how can you get to the table. And how can we bring the values of our communities into this broader conversation."
Bera and Khanna are both second-generation Indian Americans raised by parents who immigrated to the country. Many Indian American candidates come from a similar background. That includes Vice President Kamala Harris, who grew up in Oakland with a Jamaican father and mother who was born in Chennai, India.
Khanna said his parents' immigrant generation was mostly focused on settling in and making a life in the States, which led many of them to avoid rocking the boat and getting into politics.
Due to their parents' success, many second generation Indian Americans now find themselves with some advantages.
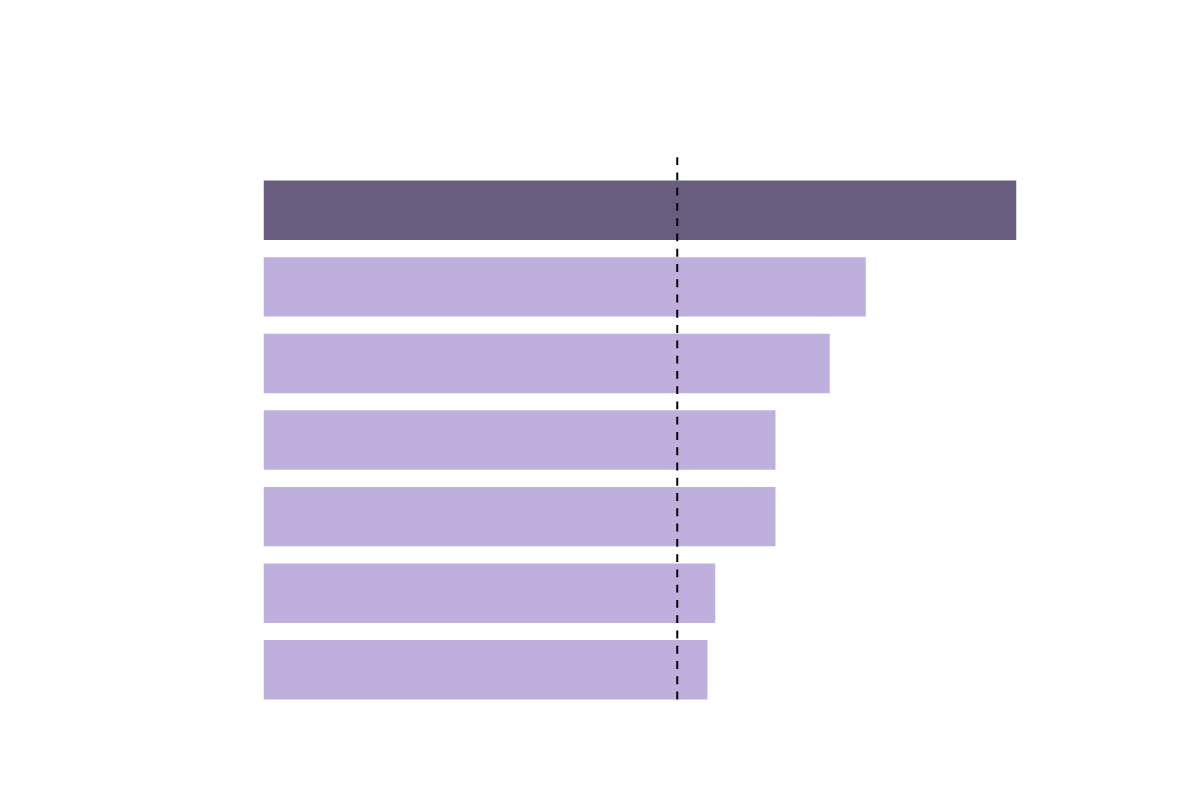
Asian American median annual income in U.S.
U.S. median income ($68,703)
Indian
$125,000
Filipino
$100,000
Other Asian
$94,000
Japanese
$85,000
Chinese
$85,000
Korean
$75,000
Vietnamese
$74,000
U.S. Census Bureau
Asian American median
annual income in U.S.
U.S. median income
($68,703)
Indian
$125,000
Filipino
$100,000
Other Asian
$94,000
Japanese
$85,000
Chinese
$85,000
Korean
$75,000
Vietnamese
$74,000
U.S. Census Bureau
Indian American wealth is a pool of money that can be tapped by political campaigns. Khanna credited the Indian and South Asian communities with generously offering to donate. After he lost his two bids for Congress, a strong South Asian base helped him on his third try.
Early in the 2020 presidential campaign, Indian American donors, many of them eager to support Kamala Harris' bid, gave more than $3 million to primary hopefuls. That haul surpassed the vaunted Hollywood donor class.
Expect this trend to continue
Organizers are now striving to build on recent successes. The Indian American Impact Fund in Philadelphia, is an example.
The group's annual budget has jumped from $300,000 to $15 million in just two years, said Executive Director Neil Makhija.
Makhija aims to use the money to mobilize voters and help candidates get elected at the state and local level, which could groom the next generation of national politicians.

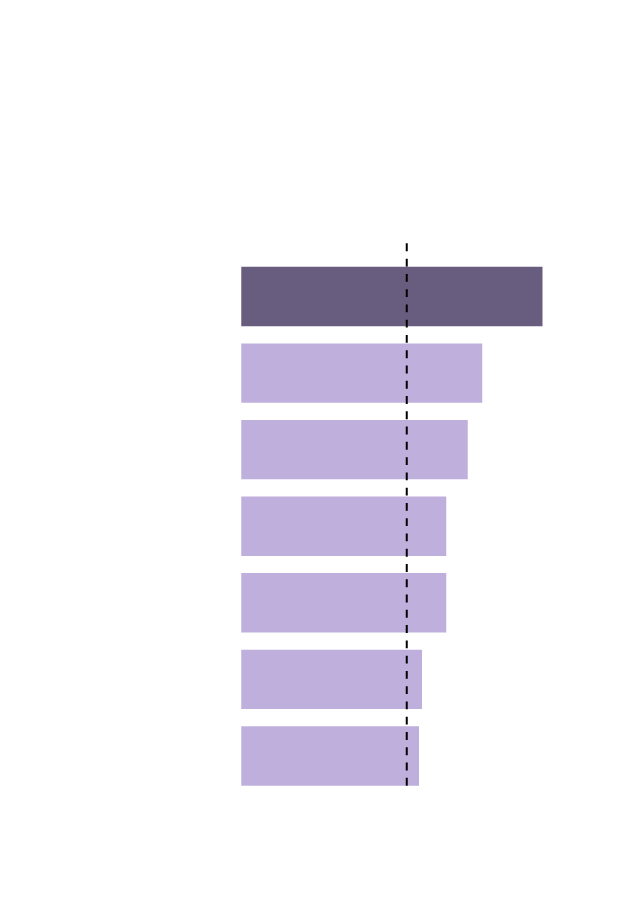
Most Asian sub-groups have only a few members in the House of Representatives...
Amount if the House was reflective of the U.S. population
Number of representatives
Chinese
2 people
5.8
Indian
4
5.6
Filipino
1
4
Other Asian
2
3.9
Vietnamese
1
2.5
0
1
2
3
4
5
6
... some have more members in the House than their U.S. population would suggest.
Korean
1.9
4
Japanese
1
2
LOS ANGELES TIMES

Most Asian sub-groups have only a few members
in the House of Representatives...
Amount if the House was reflective of the U.S. population
Number of representatives
2 people
5.8
Chinese
4
5.6
Indian
1
4
Filipino
2
3.9
Other Asian
1
2.5
Vietnamese
0
1
2
3
4
5
6
... some have more members in the House than their
U.S. population would suggest.
1.9
4
Korean
1
2
Japanese
LOS ANGELES TIMES

Most Asian sub-groups have only a few members in the House of Representatives...
Amount if the House was reflective of the U.S. population
Number of representatives
2 people
5.8
Chinese
4
5.6
Indian
Filipino
1
4
Other Asian
2
3.9
1
Vietnamese
2.5
0
1
2
3
4
5
6
... some have more members in the House than their U.S. population would suggest.
Korean
1.9
4
1
2
Japanese
LOS ANGELES TIMES
In 2020, 35 South Asian candidates ran for state office nationwide, more than double four years prior. Forty-six first-time South Asian candidates are already expected to run for similar offices in 2022, according to data compiled by the group.
One example is Janani Ramachandran, who is seeking a California State Assembly seat representing parts of Oakland and other nearby cities.
If Ramachandran wins a run-off election in August, she would become the first South Asian woman elected to the state assembly, as well as the first LGBTQ woman from any Asian group.
Ramachandran said she was inspired by the way Harris incorporated her Tamil heritage into her campaign.
“There was that moment where Kamala Harris talked about her ‘Chitti,’ and I started tearing [up],” said Ramachandran. “She's from Oakland too, and to have a Tamil woman from the Bay Area be on this national platform speaking our language was just a real moment.”