The Times’ newly formed Data and Graphics Department is merging the sciences of statistics and computer programming with the arts of reporting, writing and editing.
It’s charged with creating visual stories, investigative analysis, interactive games, automated applications and digital designs that cover the top stories in our state.
Here are 50 examples of the team’s work this past year:
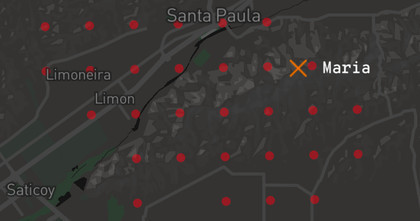
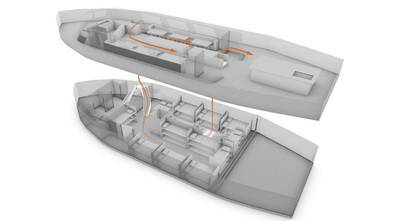
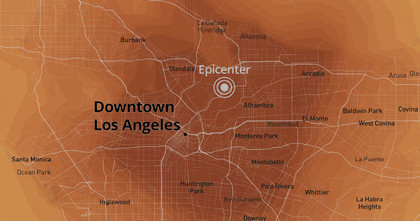
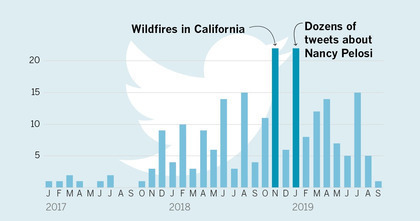
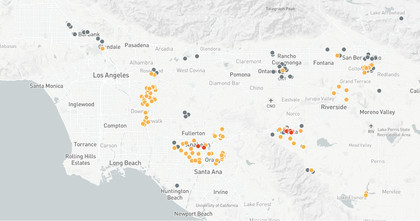
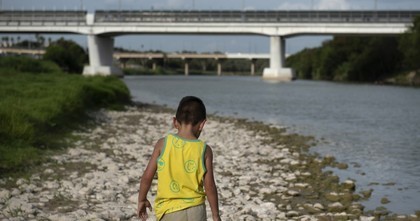
Disasters
Both natural and man-made


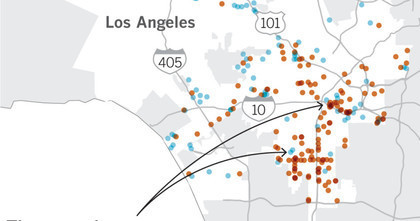
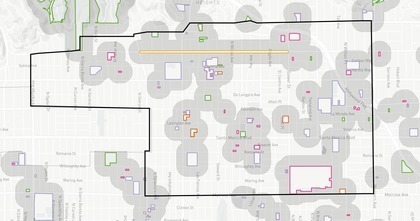
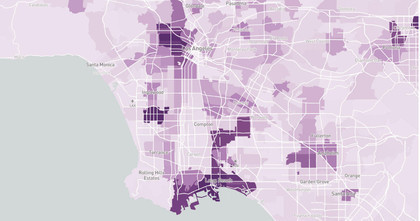
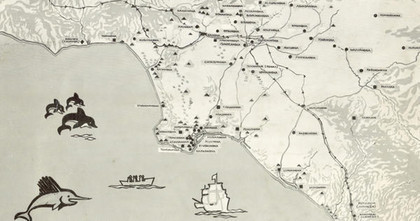
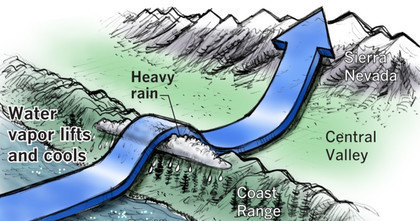
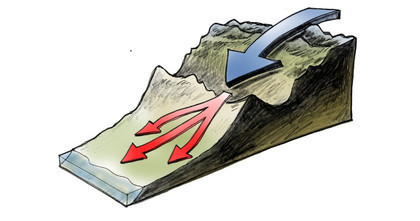
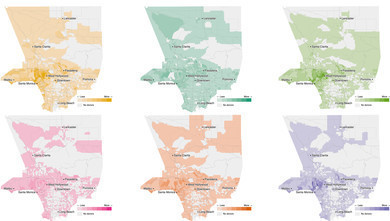
Explaining L.A.
Better understanding our arts, culture and atmosphere


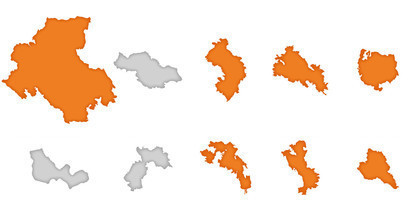
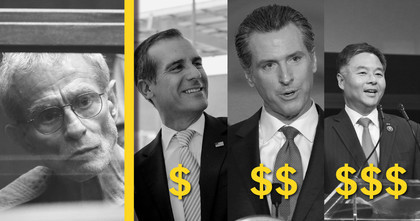
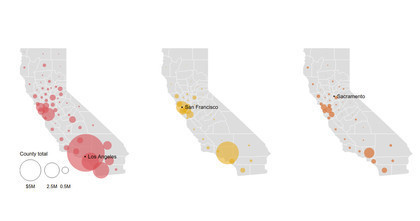
California’s campaign
Our view of 2020


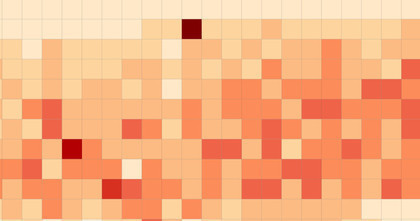
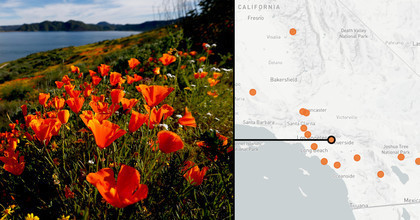
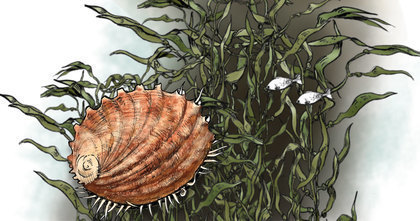
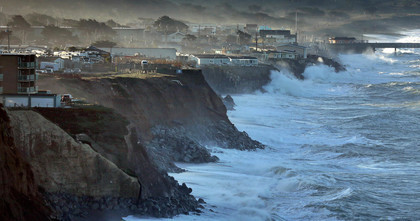
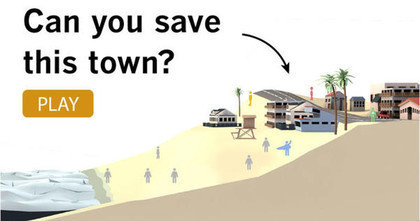
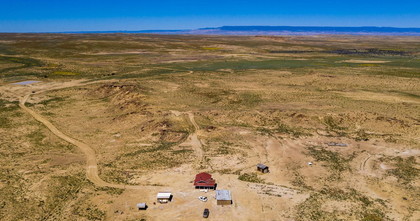
The environmental challenge
Pollution, climate change and endangered species

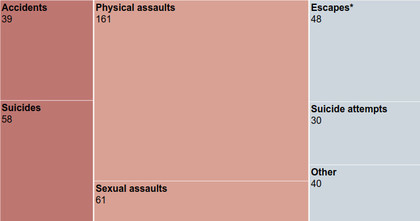
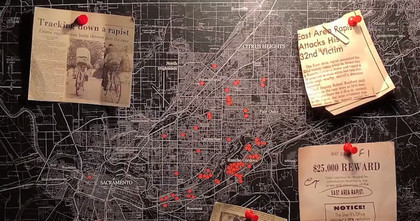
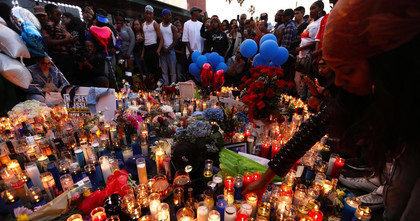
The Homicide Report
A story for every victim
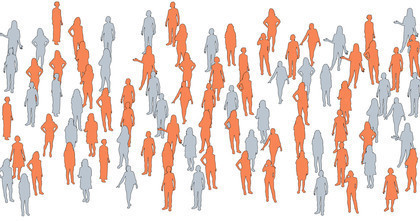


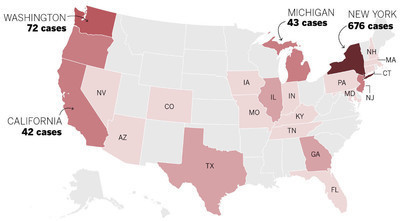
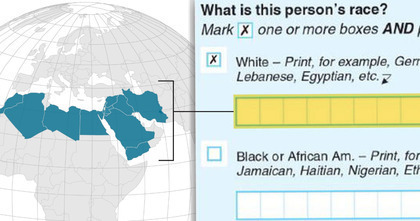
Census 2020
Warning signs for the enumeration ahead
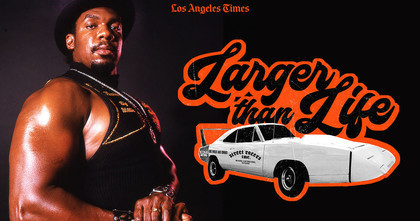
Athletics
Insights into excellence


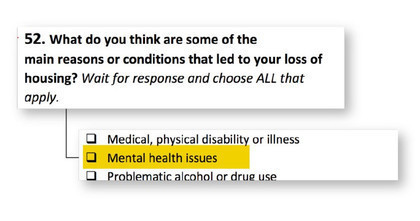
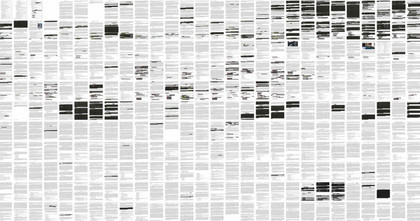
The rest
Homelessness, Hollywood, healthcare and more