Here’s the latest report card on California’s battle against climate change
New data released by state regulators provide a detailed snapshot of California’s battle against global warming. We’ve crunched the numbers on specific sources of pollution, including planes, cars and trucks, and how the state’s pollution compares to the size of its economy.
The state has been chipping away at greenhouse gas emissions in recent years. However, it’s going to need much deeper cuts to reach its goals.
Emissions have been reduced by approximately 1% each year since 2006, when California enacted its landmark law setting a target for cutting pollution that causes climate change. But to reach a newer, more ambitious goal for 2030, cuts will need to happen at about three times that pace.
California tracks emissions from each sector of the economy, and the data show how each has changed over time. Transportation remains the single largest source, and the transition from gasoline engines to electric cars has been happening more slowly than regulators want. Emissions from passenger vehicles alone jumped 4.4% in 2015 as more Californians hit the road, fueled by the economic recovery and the relatively low price of gasoline.
More progress has been made on electricity generation. Overall emissions from power plants fell 5.2% in 2015, reaching a level 30.4% lower than it was in 2008. There’s less coal power and more renewable energy being imported into the state.
Sources of California greenhouse gas emissions
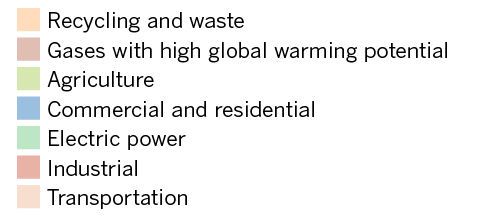
Here’s a closer look at how the state’s emissions were generated in 2015, the most recent year for which data were available. Besides transportation, industrial sources are the next largest contributors to greenhouse gas emissions.
The recession took a big bite out of California’s greenhouse gas emissions. But since then, the state has found ways to keep emissions from rising to pre-recession levels even as its economy grows. It helps that a significant portion of the recovery comes from the technology industry. Living and working in the state now uses less carbon than before, and emissions per gross domestic product and per person have been falling continuously.
Sources: California Air Resources Board
Credits: factory icon by parkjisun from the Noun Project