Don’t waste your time at Disneyland. Here’s how to avoid the lines
Visitors to Disneyland and California Adventure are experiencing more sore feet and sunburn while waiting to ride some of the parks’ increasingly popular attractions.
On the opening weekend of California Adventure’s latest attraction, a “Guardians of the Galaxy”-themed redesign of the two-minute Tower of Terror drop ride, parkgoers waited in line for up to five hours.
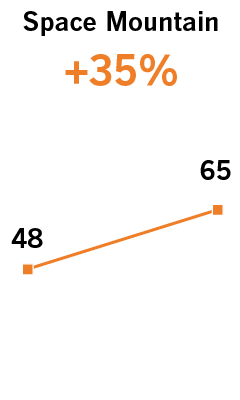
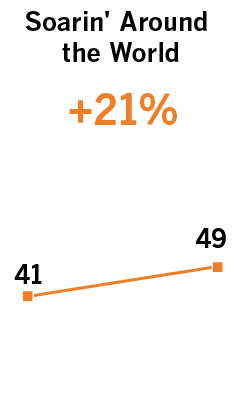
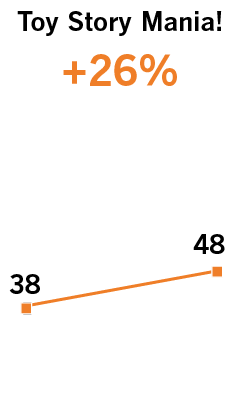
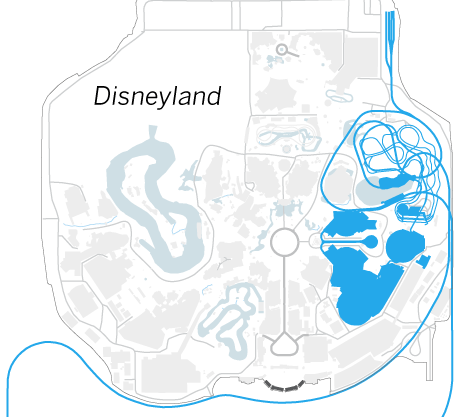
Wait times for nearly all of the resort’s most popular rides have risen, according to a Los Angeles Times analysis of data from touringplans.com. They averaged 24.4 minutes for the first six months of 2017, a 28% increase over the same period in 2015 when the park drew record-high attendance numbers.
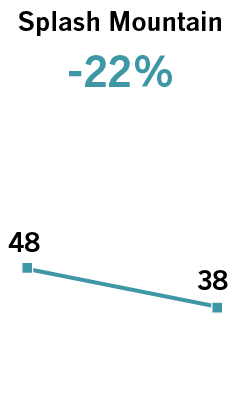
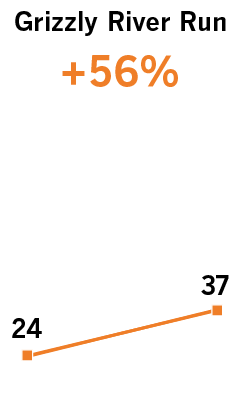
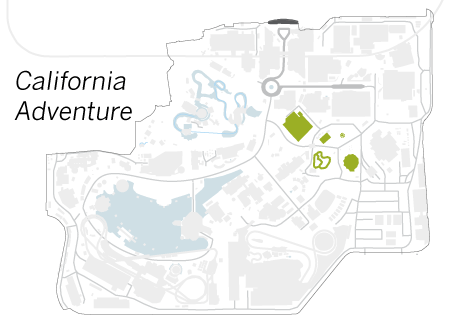
Average wait times for the busiest rides in both parks

Pick a good date — and a good month
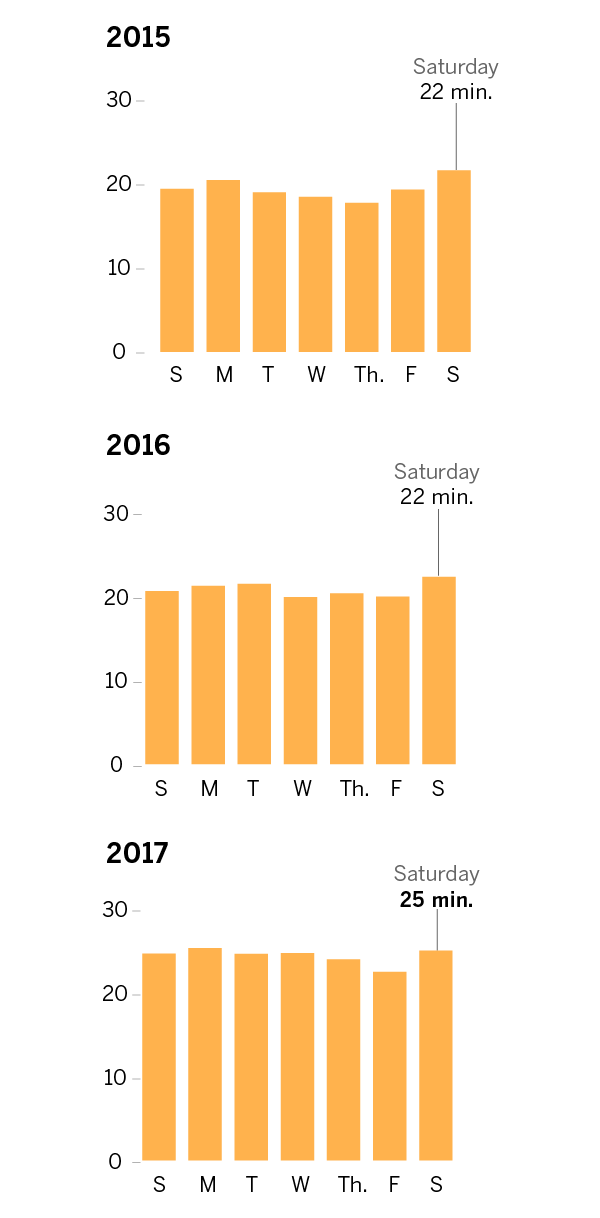
The best days to visit the parks are Wednesday, Thursday and Friday.
Average wait time by day of the week:
The best months to visit are September and January, when the average wait time per ride is under 15 minutes. Wait times are highest near major holidays.
Average minutes in line per ride at Disneyland and California Adventure
2015
2016
2017
Get there early
While wait times have increased at all times of the day over the last two years, they are still shortest right when the park opens at 8 a.m. Visitors at nearby resort hotels also have the option to enter the park for an extra hour, beginning at 7 a.m.
Average wait time by hour:

Even if you aren’t staying at the Disneyland hotels, it’s still worth heading to the parks at least a half-hour before they open. Parkgoers who show up early will be the first ones through the gates and will have the best chance of riding the most popular rides without waiting for hours.
Ditch your friends and family
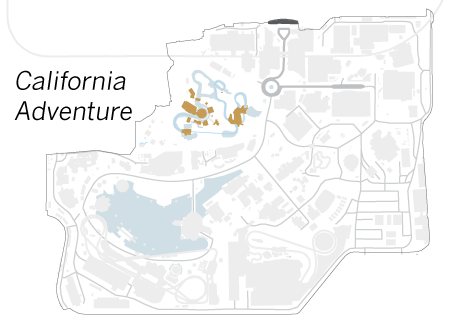
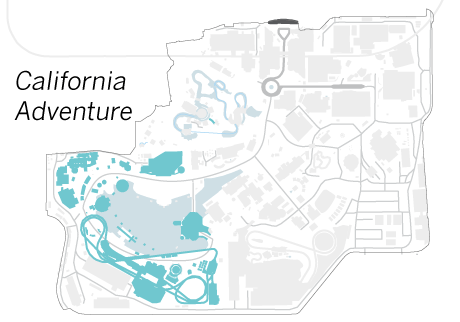
The single-rider line is your real friend. Many of the most popular rides allow single riders to walk up a separate queue that gets them on the ride faster (and helps fill seats). Look for a “single riders” sign or ask a park employee where to go.
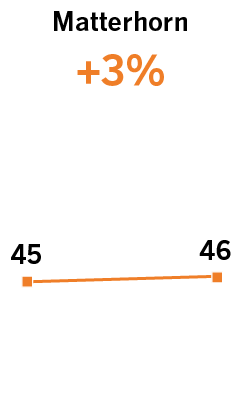
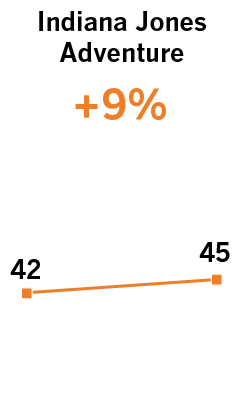
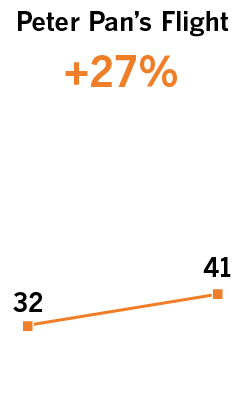
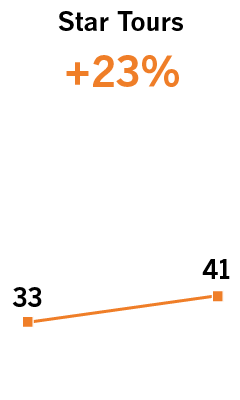
On a recent Saturday, we tested out several of the single-rider lines to see how their waits compared to the posted times. Here’s what we found:
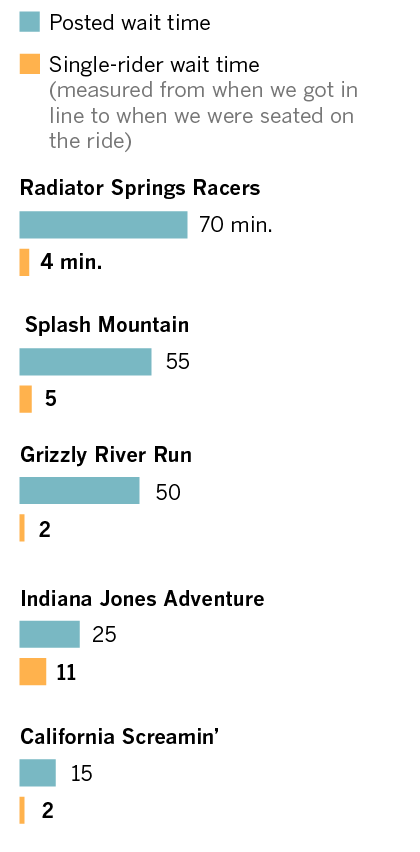
These rides have single rider lines:
- California Screamin’
- Goofy’s Sky School
- Grizzly River Run
- Indiana Jones Adventure
- Matterhorn Bobsleds
- Radiator Springs Racers
- Splash Mountain
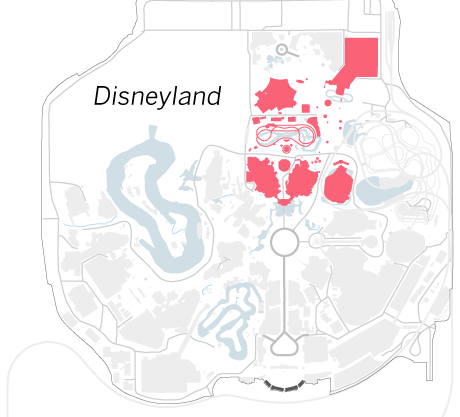
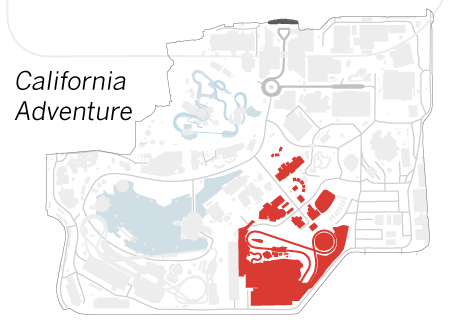
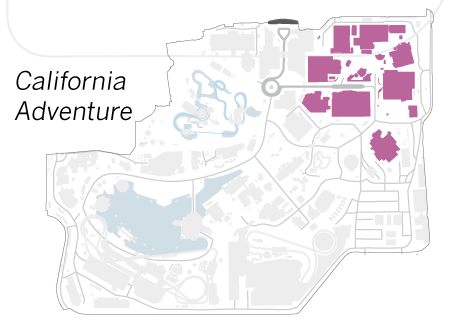
Guardians of the Galaxy: Go there first
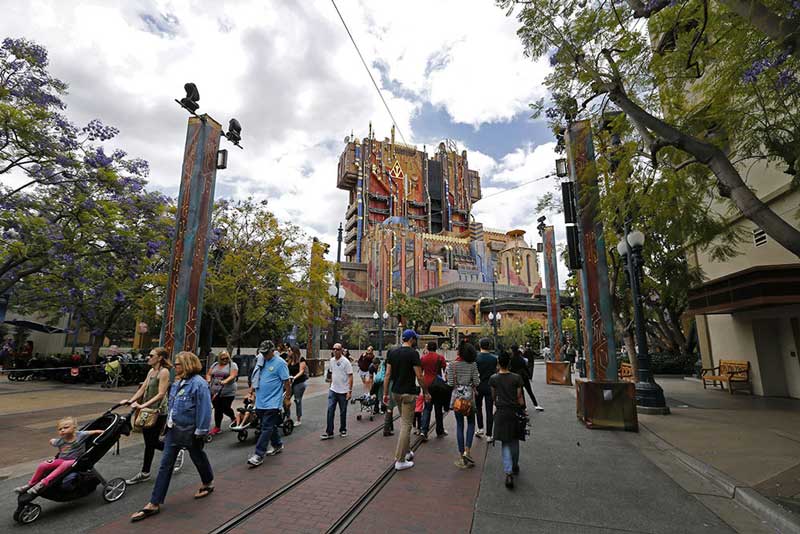
When Guardians of the Galaxy — Mission: Breakout! opened on Memorial Day weekend, its wait times soared past every other ride in either park. While the lines have come down from their peak of 5 hours, riders are still waiting about an hour and a half.
Our suggestion: If you really want to ride, be at the park when the gates open and head to Hollywood Land right away. If you miss the 8 a.m. window, be prepared to stand in line for at least an hour — or try your luck with a Fastpass, but don’t count on it. Because the ride is so popular, its Fastpass allotment can run out by 10:30 a.m.
Know when to ride
Here are all the hourly wait times for 2017, so you can plan your trip to either park accordingly. Look for rides that are equipped with Fastpass
No rides found
Tips from our readers
We asked Los Angeles Times readers if they had any Disney secrets. Got a tip of your own? Let us know on our Facebook page. Here are some of our favorites.
“There's another separate line for Dole whip on the other side of the [Enchanted Tiki Room]. Almost no line every time.”
“Arriving after 5pm on Sunday is a great way to experience all the best rides with less than 20min wait times. The park stays open until 12 on Sunday's so you can get a ton done! Plus main street stays open until 1am so there's plenty of time to shop afterwards without all the crowds. TIP: Father's Day & Easter are practically ghost towns at Disneyland:)”
“Go on a rainy day. One of those typical rainy Southern California days where it drizzles off and on throughout the course of the day and then clears up at some point. Had a day like that last year, never waited longer than 25 minutes for any ride, and went on the best rides twice. And the rain pretty much cleared up and was gone after about 5 p.m. that day.”
Sources: Data from touringplans.com, map data from OpenStreetMap contributors and Mapzen, Ant by Creative Stall, Fedora by icon 54, Traffic Cone by Atif Arshad, Acorn by Juraj Sedlák, Castle by Ruslan Dezign, Horse by stolkramaker, Mountains by Baboon designs, Roller Coaster by Susy Cerecero, Clapperboard by Michelle Fosse, Mouse Ears by Jonathan Lutaster, Rocket by Ryan Houk, Dead Pirate by Musket from the Noun Project
Credits: Data analysis by Ben Poston, animation by Swetha Kannan