UC Irvine graduate is the architect of detailed COVID-19 dashboard
- Share via
Matthew Littman has seen the coronavirus pandemic affect his life in a very tangible way.
When Littman graduated from UC Irvine last month with a Master of Science in Business Analytics degree, he did not physically walk across the stage.
Littman, 26, watched the ceremony from the couch of his Irvine home.
“It wasn’t what I was expecting, but also, it was exciting,” he said. “The class was 110 people, and we were all on a Zoom call watching the graduation.”
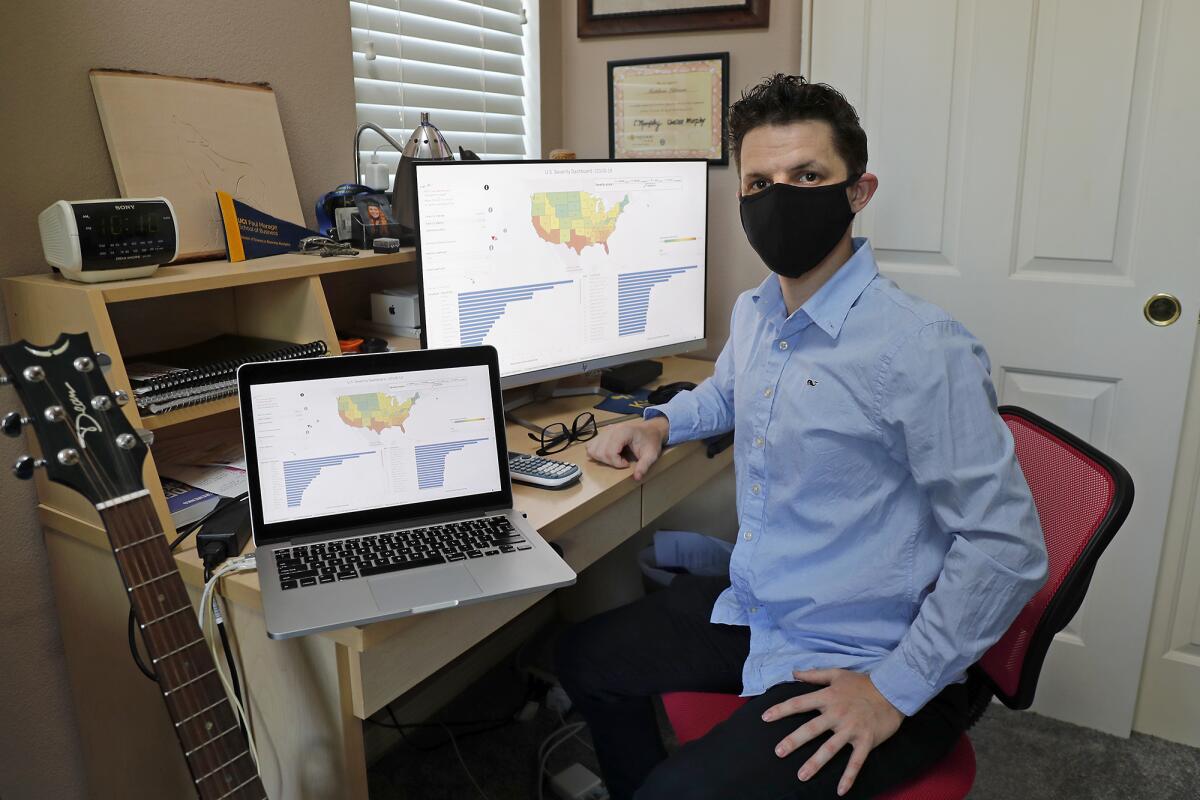
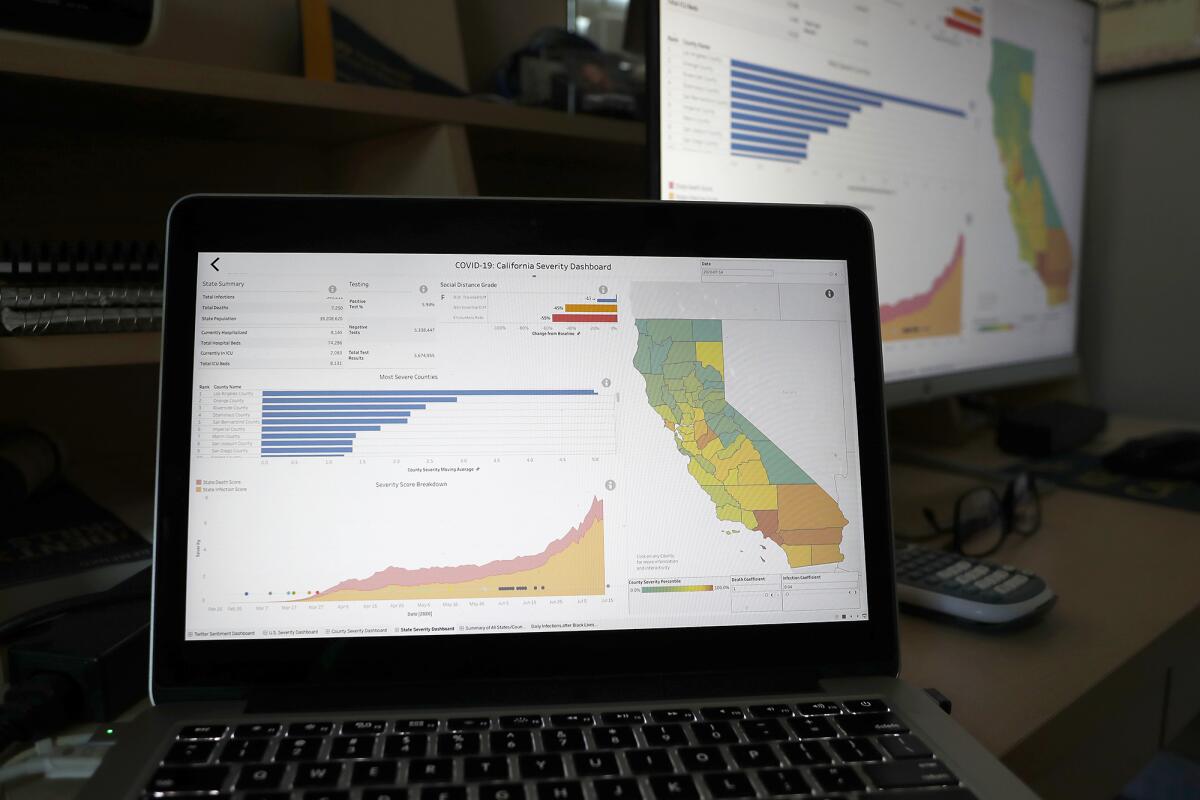
Littman’s hope with his new project is that he will be able to help others as COVID-19 rages on across Orange County, the state and the country. He has developed a COVID-19 tool — the U.S. Severity Dashboard — which he updates daily.
“My goal in doing this project is mostly to get people to be aware of how severe the virus is in their area, so that they know the risk that it is to them, but also just to take this seriously,” he said. “You can see that all of the different counties and all of the different states are starting to trend upward.”
The ongoing discussion about what school will look like in the months ahead comes on the heels of a record-breaking day among the number of daily coronavirus cases reported in the state.
The dashboard features cases and deaths but also much more. It draws data from a number of different sites, Littman said, including Johns Hopkins University, the Kaiser Family Foundation, the COVID Tracking Project and others. Littman then developed a formula to assign COVID-19 severity and response scores for any chosen region.
He also reached out to Unacast, which is providing him data on how much people are moving during the pandemic. This allows Littman to provide a social distance grade, from A through F, for a given area. Los Angeles and Orange County, as well as California as a whole, have earned an “F” grade.
The dashboard indicates that Californians have traveled 17% less than they did before the pandemic.
“We are doing less [traveling] than we were previously, but it’s not that much less,” Littman said.
The dashboard indicates continued grim numbers for Orange County. There were 22 more deaths in the county reported Wednesday, according to the Orange County Health Care Agency, bringing the death toll to 455. There were also 911 new COVID-19 cases reported overall, and the cumulative case count is 27,031.
“What is interesting about California is that they never had a period they were going down,” Littman said. “They opened everything up at a time when [the coronavirus] was still going up in severity. I don’t know if [Gov. Gavin Newsom] was pressured … because we did have protests and there were people complaining. But for example, you look at New York, they had a clear peak, they started going down and they started opening up. California, it never really went down.”
Littman previously used his statistical analysis to work on a model to predict the Super Bowl winner. Though initially he picked the San Francisco 49ers, he said the model got better and he wound up selecting the eventual champion Kansas City Chiefs before the big game.
Littman was going to turn his attention to making March Madness predictions when the pandemic hit. He has worked with UC Irvine Paul Merage School of Business professors Vibhanshu Abhishek and Arvind Sathi in developing the COVID-19 project.
Orange County Board of Education members said Monday they believe a return to schools is the best course for children, in part, because science has shown youth are not at great risk of contracting COVID-19.
“I think he’s done a very impressive job of getting all of these different data sources together, which is a big feat in itself,” Abhishek said. “I think it could lead to some very impressive research, and also, I think it’s a good guidance for the policymakers and anyone else who wants to make decisions in this situation. Over time, this has become one go-to place for all kinds of COVID-related information.
“I think it’s good, visionary thinking on his part, being ahead of the curve and sort of saying, ‘How can we get all of these pieces of information together and do something meaningful with that?’”
Littman said he will continue refining his COVID-19 dashboard. He is working on analyzing why certain counties had significant spikes following Black Lives Matter protests, while others did not. He is also leading a team working on analyzing tweets based on information from a PhD group from UC Irvine’s Donald Bren School of Information and Computer Science.
“You’d be able to look at what topics people were discussing, and whether they were positive or negative in terms of sentiment,” he said. “The goal is to say, like, if a region is talking badly about the government, are they not listening to the measures as much?”
One thing Littman makes clear is that he is taking COVID-19 very seriously. He has the numbers to back that up.
“It’s frustrating to see,” he said. “I mean, we’re at 133,000 deaths [in the country], and that’s a ton of people. What it kind of felt like after we were done with the quarantine is that people felt like they put in their two weeks and then they were like, ‘All right, back to normal.’
“They felt like they contributed what they could, and that’s not the right mindset to have for a pandemic. You need to be all hands on deck. Until this thing goes away, let’s make it so that we are as careful as possible.”
Gov. Gavin Newsom announced statewide restrictions Monday, closing all malls, indoor dining, bars, gyms, churches, hair salons, family entertainment, zoos and museums.
All the latest on Orange County from Orange County.
Get our free TimesOC newsletter.
You may occasionally receive promotional content from the Daily Pilot.

