Late to the party
Early retirement hasn’t come quite soon enough for Joe Lee.
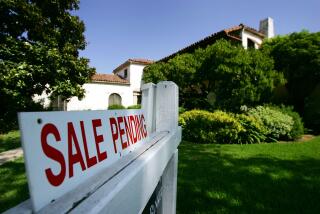
At 58, Lee has been punching a clock for 35 years for the county of Los Angeles, and he’s eager to move on to Mississippi, where he has property, family and a fiancee waiting.
But Lee’s hopes for a summer departure are diminishing each week -- that is, if he intends to hold out for anywhere near the $700,000 that he’s asking for his 2,600-square-foot, three-bedroom-plus-den home in Lynwood.
“I wouldn’t say I’m desperate, but anxious, yes, I am feeling anxious,” he said.
A year ago, $700,000 wouldn’t have been unreasonable for a comparable property in this part of Lynwood, in particular one with the graceful landscaping and custom work that Lee has put into his house during a quarter-century of ownership.
But, oh, what a year it’s been.
Real estate tracker DataQuick Information Systems reports that the median price of a single-family, detached home peaked at $599,000 in Los Angeles County in August last year (the median being the point at which there are an equal number of sales above and below). In November, the latest month for which figures are available, the median price had sunk to $529,000 -- a dip of about 11.5%. Meanwhile, market activity has plummeted. There were 5,829 single-family, detached homes sold in Los Angeles County in October and November, down 51% from the same period in 2006.
Only 52 Los Angeles County ZIP Codes registered resales of 35 single-family, detached homes or more in October and November. Of those, 32 had dropped more than 10% from their peak on a price-per-square-foot basis, according to DataQuick. Ten were down more than 20%.
Although the dearth of sales in the last year has made it difficult to pin down these figures with precision, it’s clear that Los Angeles County prices held on longer and fared better than those in most Southland counties.
In Orange County, prices peaked in June at a median of $734,000. By November, the median was $655,000 -- a 10.8% drop.
In Riverside County, the peak came a year earlier, in June 2006, at $419,000. That figure had dipped to $340,000 by November, according to DataQuick, for an 18.9% decline.
Blame it on real estate cycles, bad lending practices, unrealistic buyers or the now-befuddling run-up in prices that sent values way beyond the reach of the average family, but there’s no doubt that Southern California residential real estate is in the midst of a painful fall. Few expect the soon-to-be-released December sales data to add any sunshine to this gloomy picture.
Lions and tigers and bears, all right. To hear Christopher Thornberg of Los Angeles consulting firm Beacon Economics tell it, home sellers can expect the bad times to get worse, and to stick around for a while.
“There will be close to a 30% decline” from the peak, Thornberg said. “Prices will continue to go down in 2008. I think between 2009 and 2011, we will have what you call a ‘bleeding phenomenon’ where prices stay flat, which means they lose value in real terms.” Losing value in real terms occurs when appreciation fails to keep pace with inflation.
Thornberg’s advice for would-be sellers and those struggling to pay readjusted mortgages: Get out now.
“If you sit on the sidelines, it is going to get worse,” he said. “And if you want to sell your house now, price it down big time.”
Paying the piper
Before launching Beacon, Thornberg wrote reports for the UCLA Anderson Forecast, which warned as early as 2001 that easy credit was propelling home prices to unsustainable levels. Now, he said, homeowners are paying the price.
But not everyone is as bearish as Thornberg.
DataQuick analyst John Karevoll says the uncertain state of the national economy makes forecasting a tricky proposition.
“Jobs, growth in the economy, interest rates -- all of these things are highly volatile,” Karevoll said. “It’s almost impossible to make a reliable prediction because of the volatility of these numbers.”
If the United States manages to avoid a recession, Karevoll said, prices will probably stabilize this summer or autumn -- well short of the 30% decline suggested by Thornberg.
“First, we have to digest this bad apple we ate with these sub-prime mortgages,” he said.
But what if there is a recession?
“Things will get much worse,” Karevoll said. “There is a high proportion of California homeowners -- not most, but a high proportion -- that are near a financial edge. In a recession, they will get pushed over that edge and things will get downright bloody.”
Lee, who listed his home for sale three months ago, doesn’t need an economist to know he’s missed the boat. He’s already reduced the price of his property by $25,000 -- that’s just 3.5% from where he started -- and recognizes that he may need to go lower.
“Twelve months, 18 months ago, it would have been much easier. My timing is a little off,” he said. “But there’s no reason for me to hang around waiting for it to get better, because I don’t think it will any time soon.”
DataQuick findings appear to bear out his angst. In Lee’s Lynwood 90262 ZIP Code, prices on a per-square-foot basis have dropped more than 17% since their all-time peak in the second quarter of last year, according to the DataQuick numbers. Other communities in the southern part of the county, such as Watts, Compton and North Long Beach, also have seen steep declines.
But it could be worse. Lee could be living in the Antelope Valley.
The downward spiral of prices in Los Angeles County has been most severe in Palmdale and Lancaster, areas where a disproportionately high number of buyers took advantage of adjustable-rate or interest-only mortgages. The northern county region is being hammered by a poisonous trifecta of high numbers of homes for sale, rampant foreclosures and the disappearance of easy credit. Many buyers are seeing their home values erode as their payments balloon.
Prices for single-family, detached homes in the Lancaster ZIP Codes 93534, 93535 and 93536 reached all-time peaks in the second and third quarters of 2006, according to DataQuick. By the beginning of December, they had plunged 25.5%, 27.9% and 25.6%, respectively, on a per-square-foot basis. In Palmdale, the 93550, 93551 and 93552 ZIP Codes have seen prices drop by more than 24% since peaking in the first half of 2006.
Uneven distribution
One thing that is evident is that the pain is not being evenly spread around.
Despite the steep downturn in the high desert, Karevoll said Los Angeles County will hold up much better than Riverside County, for example. That’s because Los Angeles County contains a much higher percentage of older housing stock and neighborhoods where people have owned their homes for a long time.
“If you go down to southern Riverside County, maybe half of the homeowners bought their houses during the run-up or at the peak,” he said. “A lot of those people are in trouble.”
It’s also true that, in general, the more affluent a neighborhood, the better it’s holding up. Take, for example, the famed 90210 ZIP Code in Beverly Hills. Sales were down slightly last year, but prices continued to rise -- peaking in the fourth quarter and finishing the year 34% higher on a price-per-square-foot basis. In the Pacific Palisades’ ZIP Code 90272, sales activity was off by 37% in October and November compared with the previous year, but prices nevertheless went up 34% on a price-per-square-foot basis.
But those neighborhoods are exceptions to the rule. Peter LaMonica, an agent with Re/Max Grand Central in the San Fernando Valley, specializes in an upscale part of Woodland Hills known as Vista de Oro. Much of that tract is in the 91364 ZIP Code, where prices have dropped more than 11% on a per-square-foot basis since peaking in the second quarter of 2006. (Due to scant sales in that area, that percentage is based on quarterly sales of only 25 or more homes.)
The situation of one of his clients illustrates the predicament many homeowners are in, he said. The client listed a four-bedroom, three-bath, 2,600-square-foot ranch-style home on Dumont Place for $1,249,000. The home was purchased in 2004 for about $980,000.
“They financed the whole mortgage, and then they refinanced and took about $100,000 out,” LaMonica said. “They’ve got a situation where their break-even point is $1,150,000. I just don’t know if it’s realistic for them to get that.”
Echoing Thornberg, LaMonica is advising clients who are thinking about selling in the next few years to put their homes on the market right away -- and to price their properties lower than the comps.
“In this market, if we accidentally price your house too low, it could be a blessing,” he said. “It’s a big mistake to wait 60 or 90 days before lowering the price. You’re going to get the greatest amount of exposure at the beginning of the listing.”
Carol Zinsmeister learned that lesson the hard way.
Zinsmeister, who retired three years ago from her job as a clinical faculty coordinator at UCLA Medical Center, listed her well-maintained, three-bedroom, one-bath home in Lake Balboa, a neighborhood in Van Nuys, for $525,000 in July. She’s since cut her price to $433,000, with nary an offer to show for it. Only two prospective buyers have visited the house since October.
“I should have listed it for $475,000 in August. It might have sold,” said Zinsmeister, whose plans of making her retirement home in Mission Viejo are in limbo. “I can’t go down too much further because I will price myself out of where I want to go,” she said.
Zinsmeister’s 91406 ZIP Code has experienced a nearly 16% drop on a per-square-foot basis, since peaking in the first quarter of 2006, according to DataQuick. But she need only glance across her front lawn to see how things have changed.
The house next door to Zinsmeister’s -- a fixer with slightly more square footage than her own -- sold for $465,000 to investors in August 2006. The buyers did a little a cosmetic work and quickly turned it around for a small profit, according to the family that initially sold the home.
Zinsmeister, who has owned her home for 25 years, said that it’s hard not to feel nostalgic for 2006, when homes in the neighborhood were still being snapped up at a rapid pace.
“I did open houses -- it brought nothing. I’ve done all the fliers -- nothing,” Zinsmeister said. “The buyers now want you to pay the closing costs, make repairs, take them to dinner and all that. They’ve really got you.”
--
(BEGIN TEXT OF INFOBOX)
Past prime time in Los Angeles County
The chart lists the median price paid per square foot for the 52 L.A. County ZIP Codes that had at least 35 resales of single-family, detached houses in October-November. If a peak median had been reached in more than one period, the most recent period is listed.
*--* -- ZIP Oct.-Nov. Peak Date % Oct.- Code ’07 med. med. of peak Nov. ’07 -- -- $ sq ft $ sq ft off peak L.A. County -- $371 $406 2007Q2 -8.6% Altadena 91001 $447 $474 2007Q2 -5.8% Arcadia 91006 $427 $478 2006Q3 -10.7% Baldwin Park 91706 $342 $385 2006Q4 -11.3% Beverly Hills 90210 $992 $992 2007Q4 0.0% Burbank 91505 $489 $520 2005Q4 -5.9% Cerritos 90703 $397 $409 2006Q1 -2.9% Claremont 91711 $332 $345 2006Q1 -3.7% Diamond Bar 91765 $305 $345 2006Q1 -11.5% Granada Hills 91344 $324 $388 2006Q2 -16.5% Hacienda Heights 91745 $312 $371 2006Q2 -15.9% Hawthorne 90250 $420 $472 2007Q2 -11.1% LA 90047 $349 $390 2007Q2 -10.5% La Mirada 90638 $323 $410 2006Q2 -21.1% La Puente 91744 $352 $386 2006Q2 -8.8% LA/August F. Haw 90059 $298 $374 2006Q4 -20.4% LA/August F. Haw 90044 $352 $385 2007Q1 -8.6% LA/Hollywood 90068 $582 $642 2007Q2 -9.3% LA/Mar Vista 90066 $635 $654 2007Q3 -2.8% LA/Watts 90002 $348 $407 2006Q3 -14.4% LA/Westchester 90045 $526 $574 2007Q2 -8.4% Lakewood 90712 $397 $447 2005Q4 -11.2% Lancaster 93535 $150 $208 2006Q2 -27.9% Lancaster 93536 $154 $207 2006Q2 -25.6% Lancaster 93534 $159 $213 2006Q3 -25.5% Long Beach 90805 $346 $429 2006Q1 -19.3% Long Beach 90808 $375 $463 2005Q4 -19.0% Long Beach 90807 $381 $457 2006Q3 -16.6% Long Beach 90815 $407 $454 2006Q1 -10.3% Manhattan Beach 90266 $786 $791 2006Q3 -0.7% Norwalk 90650 $359 $439 2006Q3 -18.3% Pacific Palisades 90272 $1,093 $1,093 2007Q4 0.0% Pacoima 91331 $356 $411 2006Q4 -13.4% Palmdale 93552 $159 $222 2006Q1 -28.5% Palmdale 93550 $176 $244 2006Q2 -27.9% Palmdale 93551 $163 $216 2006Q2 -24.6% Palos Verdes 90274 $645 $674 2006Q1 -4.3% Peninsula Pomona 91766 $286 $344 2006Q2 -16.8% Pomona 91767 $277 $319 2006Q4 -13.2% Rancho Palos Verdes 90275 $481 $552 2006Q2 -12.9% Redondo Beach 90278 $550 $561 2006Q2 -2.0% Reseda 91335 $337 $412 2006Q1 -18.2% Rowland Heights 91748 $274 $350 2006Q2 -21.7% San Dimas 91773 $324 $353 2006Q1 -8.3% San Marino 91108 $632 $651 2007Q3 -3.0% Sylmar 91342 $347 $387 2006Q3 -10.2% Valencia 91354 $304 $337 2006Q3 -9.7% Van Nuys 91406 $361 $428 2006Q1 -15.7% Walnut 91789 $332 $368 2006Q1 -9.7% West Hills 91307 $316 $395 2006Q3 -20.2% West Hollywood/LA 90046 $664 $727 2007Q2 -8.7% Winnetka 91306 $342 $386 2006Q3 -11.5% Woodland Hills 91367 $358 $418 2006Q2 -14.3% *--*
Source: DataQuick Information Systems


