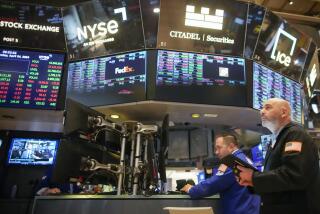
Wall Street isn’t the economy
People say that economics is complicated. But it sure looks simple to me. After all, what’s so complicated about a sector that can be represented in a single arrow? Up for good, down for bad. And if that weren’t easy enough, we’ve got green for good, and red for bad. It’s child’s play. It even looks like a toy I played with as a child. The green arrow made a cow moo, as I remember.
Looks, however, can be deceiving. And so it is with the ubiquitous stock ticker arrow that increasingly serves as a stand-in for broad economic data. More and more, the arrow is all that’s discussed -- did stocks rise or did they fall? -- as if the movement of the market were synonymous with the fortunes of the economy.
This approach is perhaps best demonstrated by CNBC commentator Larry Kudlow, who routinely writes and says things like, “The stock market actually rose in August, and opened higher in the first day of September trading earlier this morning. If stocks are optimistic, then so am I.”
But Wall Street is not Main Street. Its fluctuations may demonstrate economic health and distress, but they may not. The stock market can go up for a variety of reasons. It can be reacting to evidence of rapid, broadly shared economic growth -- or the prospect of such growth -- and in those cases, it should elicit a cheer from us all. But it also can be reacting to higher corporate profits that come not from increased productivity or growth but directly out of wages, benefits, higher prices or a variety of cost-saving, corner-cutting measures that don’t make the median American’s life any better.
Sometimes, the market is just reacting to shortsighted business practices that supercharge earnings, but only temporarily -- as in the case of the housing boom. Or it can go up because of simple irrational exuberance that is reversed with the next morning’s trading -- or the next year’s crash. The market’s fluctuations may not say much about the economy, they may not be as simplistically positive or negative as they seem at first glance, and they may not signal durable trends. They must be treated with care.
The media, however, don’t have a whole lot of time to treat them with care. In an age of 24-hour financial channels and daily business broadsheets, the allure of an easily comprehensible number that comes out every few seconds and can serve as the subject for further commentary is hugely seductive. Increasingly, the stock tickers serve the same purpose in economic reporting that poll numbers serve for political scribes: They provide constant, reportable data that can be used to draw broad conclusions about the subject as a whole -- but at a cost of accuracy, random fluctuations and significant separation from the issue at hand.
Just as polls are used because the more significant data (such as vote totals) only come out sporadically, so too is the stock ticker helpful to fill time between the monthly job reports, quarterly growth numbers and yearly census data. But polls at least pretend to reflect the relevant metric: election results. The stock market, however, lays claim to no such relevance. If the jagged line tumbles down, it does not mean the average American’s income has fallen as well. If the line shoots up, it does not mean child poverty has abated.
Indeed, in an era of inequality like the one we’re going through now, in which the Center on Budget and Policy Priorities says the top 1% control an astounding 19% of the nation’s income, the market is less attached to the fortunes of ordinary Americans than ever. In 2004, the wealthiest 1% of Americans owned 36.9% of all stock. The wealthiest 10% controlled 80% of all stock. That means the skips and dips of the market tell you very much about how the best-off are doing, but considerably less about how the great bulk beneath are faring.
To focus on the performance of the market, then, is to zero in on an economic indicator that can do well even as the country does poorly. In 2006, for instance, the Dow Jones industrial average hit highs. According to the just released census data, however, median earnings fell 1%, and millions more Americans entered the ranks of the uninsured. Indeed, from 2000 to 2007, the S&P 500 gained more than 500 points; meanwhile, the median household’s income, at least as of 2006, fell by more than $900.
Part of the reason the movements of the stock market get so much more attention than those of the labor market is that the stock market more directly affects those with the power to publicize it. It is said that a recession is when your neighbor loses his job, and a depression is when you lose yours. Both, however, may pass without the individuals who run the nation’s media properties feeling even the slightest tremor of insecurity.
This is not their fault. We are an unequal nation, and our experiences of the economy are deeply varied. But the professional classes do own stock. When the market goes down, that represents, for them, real losses, and, on a gut level, a real story. Conversely, when the census numbers are released and earnings continue to stagnate, those are numbers without any connection to the economy that reporters and editors tend to experience. And that’s not even to get into their need to attract wealthy readers and viewers -- those who are more likely to own stock -- in order to keep advertisers happy. It’s no wonder, then, that the twists of the market are followed closely by the media.
The economy, however, is a complicated thing, particularly as inequality wrenches us further and further apart from one another. The merry green arrow not only neglects the hungry child but the median worker. It tells the story of one of our many economies, but not all, nor even most. And we can’t be unduly distracted by it.
Ezra Klein is a staff writer at the American Prospect. He blogs at EzraKlein.com.
More to Read
A cure for the common opinion
Get thought-provoking perspectives with our weekly newsletter.
You may occasionally receive promotional content from the Los Angeles Times.


