Must Reads: The U.S. birthrate hits another record low. Even women in their 30s are having fewer babies

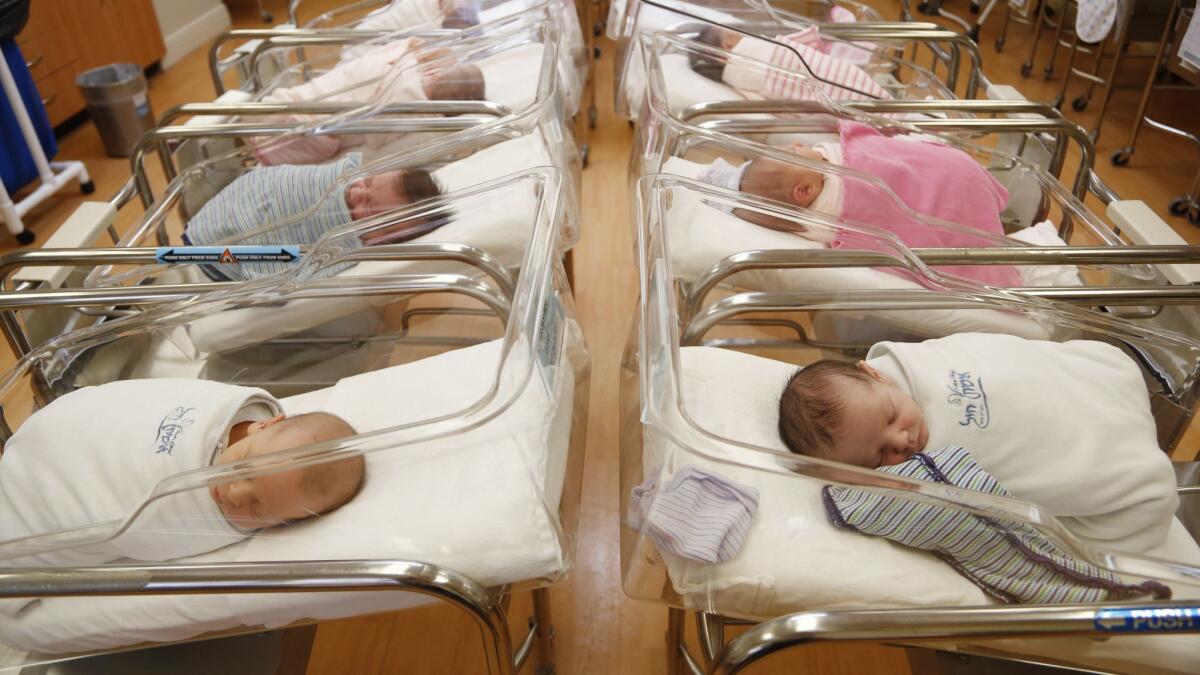
America’s birthrate hit yet another record low in 2017, as mothers in nearly all age groups gave birth to fewer babies last year than they had the year before, according to the Centers for Disease Control and Prevention.
The U.S. birthrate has been falling for several years, led by declines among younger women in their teens and early 20s who seemed to be putting off motherhood until they were older. But in 2017, women in their 30s joined the trend as well.
Here’s a closer look at the youngest Americans and their mothers, courtesy of birth records compiled by the CDC’s National Center for Health Statistics.
60.2
That’s how many babies were born in 2017 for every 1,000 women of childbearing age. This figure is known as the general fertility rate, and this is the lowest it has been since officials began keeping track, according to the report. (The CDC considers women between the ages of 15 and 44 to be of childbearing age.)
3%
That’s the percentage the general fertility rate declined from 2016 to 2017. It was the biggest one-year drop since 2010.
2%
The percentage decline in the actual number of babies born in the U.S. in 2017 compared to 2016. If you add up all the births across the 50 states, the District of Columbia, Puerto Rico, Guam and the Northern Marianas, you get 3,853,472 babies. (Figures were not available for the Virgin Islands or American Samoa.)
1987
The most recent year in which the total number of U.S. births was lower than it was in 2017.
1,764.5
That’s the total number of births expected for a hypothetical group of 1,000 American women over the course of their lives. Statisticians call this the total fertility rate, and they calculate it according to the birthrates for women of different age groups.
3%
The decline in the total fertility rate between 2016 and 2017. It’s the biggest one-year drop since 2010.
1978
That’s the last year the total fertility rate was lower than it was in 2017.
2,100
That’s how many babies this hypothetical group of 1,000 women would need to have over their lifetimes for their generation to replace itself. The actual U.S. total fertility rate has generally been below 2,100 for 46 years.
100.3
The number of babies born in 2017 for every 1,000 women between the ages of 30 and 34. This was the age group with the highest birthrate, even though it fell 2% from 2016 after rising steadily since 2012.
0
The number of other age groups with a birthrate above 100. It was 71 per 10,000 for women ages 20 to 24, 97.9 per 1,000 for women ages 25 to 29, and 52.2 per 1,000 for women ages 35 to 39.
2%
The increase in the birthrate for women ages 40 to 44. This was the only age group to see its birthrate go up in 2017, with 11.6 births for every 1,000 women in their early 40s.
0.9
The number of babies born for every 1,000 women ages 45 to 49. This birthrate was unchanged from 2016.
7%
The decline in the teen birthrate between 2016 and 2017.
18.8
The number of babies born per 1,000 women ages 15 to 19 in 2017. This is the lowest birthrate on record for U.S. teens and is 70% below its most recent peak in 1991.
0.2
The number of babies born for every 1,000 girls between the ages of 10 and 14. This birthrate has not changed since 2015.
77.3%
The percentage of all women who gave birth in the U.S. last year and began receiving prenatal care in their first trimester.
Early access to prenatal care was not spread evenly among all racial and ethnic groups, however. First-trimester care was reported for 82.5% of white mothers, 81.1% of Asian mothers, 72.3% of Latina mothers, 66.6% of black mothers, 63.5% of American Indian and Alaska Native mothers and 52.1% of Native Hawaiian and other Pacific Islander mothers.
6.2%
The percentage of women who gave birth last year without seeing a doctor during their pregnancy. This was the case for 20.3% of Native Hawaiians and other Pacific Islanders, 12.6% of American Indians and Alaska Natives, 10.2% of black mothers, 7.7% of Latina mothers, 5.1% of Asian mothers and 4.4% of white mothers.
3
The number of consecutive years that the preterm birthrate – the percentage of all births that occurred before 37 weeks’ gestation – has increased in the U.S. In 2017, it was 9.93%.
8.27%
The percentage of all infants who weighed less than 2,500 grams (or 5 pounds, 8 ounces) at birth. That qualified them as low birthweight babies. Like the preterm birthrate, the low birthweight rate also increased for the third year in a row.
Follow me on Twitter @LATkarenkaplan and "like" Los Angeles Times Science & Health on Facebook.
MORE IN SCIENCE
To prevent recurrent strokes, should aspirin have a wingman? Maybe not
FDA approves Lucemyra to treat symptoms of opioid withdrawal and help patients overcome addiction


