L.A. Unified’s Decline in SAT Scores Continues : Education: Results lag behind state, U.S. averages for sixth consecutive year.
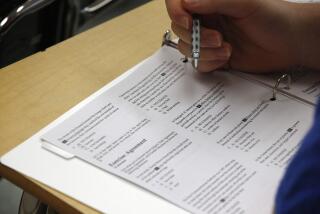
Los Angeles Unified students continue to perform poorly on the SAT college entrance exam, scoring well below state and national averages for the sixth consecutive year, according to test results released today.
Seniors who took the Scholastic Assessment Test in the spring scored an average of 351 points in the verbal section and 418 in math, more than 60 points below their counterparts nationwide. In 1994, students scored a 353 average in the verbal section and 424 in math. The best possible score is 80O points on each section.
“We need to look at these scores as another challenge to the district,” said Linda Lownes, a testing coordinator for the Los Angeles Unified School District. “Every time we see test results from our kids, we’re looking that challenge right in the face.”
District officials attribute the decline in part to growing numbers of students who do not speak fluent English. About 64% of the 11,337 city school seniors who took the SAT last March learned English as a second language, compared to 35% statewide and 17% nationwide, officials said.
In addition, large numbers of Los Angeles Unified students take the college-entrance exam, including many with only average grades, bringing down the overall average, district officials said. But Board of Education President Mark Slavkin said the district should stop making excuses for its poor performance, which includes a nearly 44% dropout rate.
“The goal is to get higher achievement at all levels. We’re not there and we need to get there,” Slavkin said.
Students such as Armine, a 17-year-old graduate of Silver Lake’s Marshall High School whose first language is Armenian, said the test was grueling--particularly the verbal section.
“English for me was much harder than math,” said the girl, who did not want her last name published. “The vocabulary was hard. All my friends felt the same way.”
Despite the overall decline districtwide, some schools showed increases over last year. At San Fernando High, for example, scores increased by 4 points in verbal to 325 and by 6 points in math to 395.
“This is my first day back, and this is good news,” said Harold Soo Hoo, the school’s college adviser. “We had a very motivated group, and that made a difference.”
Soo Hoo said more seniors at the school took preparatory courses and attended workshops prior to taking the SAT. Additionally, he said, more seniors took the exam twice, first in their junior year.
At Verdugo Hills High, Assistant Principal Carol Gorton said the seniors’ scores in the verbal section increased 16 points to 367 and in math by 33 points to 445.
“I’m pleased our scores went up--that’s going in the right direction,” Gorton said. “But we still didn’t go where we’d like.”
The test, taken last March, was the first in a series of revised exams. Math questions are now more open-ended, and students are permitted to use calculators. The verbal portion has questions based on significantly longer reading passages. In general, students have more time to answer fewer but more difficult questions.
Los Angeles students who took the exam had a mixed reaction to the results.
Tawni Takagi, 17, a Chatsworth High School graduate, said no one should be surprised by the low scores, considering the environment at most city high schools.
“There are too many kids in the classroom and not enough discipline,” she said. “I’ve seen fights break out in class. The teachers are like, ‘I don’t care. I’m not going to get involved. I don’t get paid enough for this job.’ ”
Other students, such as Lillian Montenegro, 17, of the Pico-Union neighborhood, said private SAT preparation courses--which are taken by many middle-class students nationwide--are too costly for many local students.
“I never even took one of these college-prep courses,” said Lillian, who attended Birmingham High School and achieved a 1,310 score on the SAT. “I mean, who can afford to pay?”
Tara Milich, 17, of West Covina said she took a test preparation course but still failed to raise her scores high enough to be accepted at UCLA.
“I had to pay $1,000 to prepare myself for the test and still got a pretty bad grade,” said Tara, who will attend Cal State Northridge in the fall.
Some students didn’t even crack a book.
Delvin Stephenson, who graduated from Westchester High School, said he didn’t study for the test because he wanted to see how well he could do with no preparation. He scored a 680.
“I learned I didn’t know as much as I thought I knew,” he said.
While slightly fewer seniors took the SAT last spring than had in previous years, district officials said the large numbers of students taking the exam tend to reduce the district average.
“We have both extremes,” said Margaret Evans, the testing coordinator at Marshall High. “We have those who do real well and we have those who don’t even speak English. That always holds us back.”
In the William S. Hart Union High School District in Santa Clarita, students averaged 442 in the verbal portion and 519 in math. Gary Wexler, the district’s curriculum and instruction director, said more students are taking Advanced Placement courses and even enrolling in community college courses, all of which lead to higher SAT scores.
“We’re on the right track going in the right direction at the right speed,” Wexler said.
Shuster is a Times staff writer and Kirca is a special correspondent.
* FLYING COLORS: Students nationwide post dramatic gains in revised test.. A29
(BEGIN TEXT OF INFOBOX / INFOGRAPHIC)
Top SAT Scores
Valley LAUSD schools with the highest average SAT score totals in 1995:
Van Nuys: 965
El Camino Real: 948
North Hollywood: 914
Sherman Oaks CES: 903
Cleveland: 899
Note: Perfect SAT score is 1,600
Source: L.A. Unified School District
(BEGIN TEXT OF INFOBOX / INFOGRAPHIC)
SAT: New Test, Changing Scores
The Los Angeles Unified School District’s Class of 1995 scored well below state and national averages. The Scholastic Assessment Test was revamped last year to better measure students’ verbal and math skills. Scores jumped in the state and nationally, which officials attribute in part to the new types of questions.
State and National Averages
California Averages
*--*
1994 1995 Verbal 413 417 Math 482 485 National Averages Verbal 423 428 Math 479 482 Los Angeles Unified School District Verbal 353 351 Math 424 418
*--*
****
Changes in the SAT
In the new version of the SAT, the 30-minute standard written English test has been dropped. Also, for both sections, students now have 75 minutes to answer questions, up from 60 minutes. Other changes:
Verbal Section
* Total of 78 questions, down from 85.
* 51% reading questions, up from 29%.
* Reading passages are 400 to 850 words, up from 200 to 450.
* Antonym questions have been dropped.
****
Math Section
* More emphasis on application of concepts and interpretation of data.
* 15 multiple-choice questions on quantitative comparisons, not 20.
* Use of calculators recommended.
****
*--*
1994 1995 Birmingham Verbal 372 375 Math 448 442 Canoga Park Verbal 368 345 Math 450 445 Chatsworth Verbal 400 402 Math 488 473 Cleveland Verbal 409 425 Math 470 474 El Camino Real Verbal 424 431 Math 507 517 Francis Poly Verbal 330 312 Math 415 383 Granada Hills Verbal 403 387 Math 509 493 Grant Verbal 378 368 Math 463 462 Kennedy Verbal 353 371 Math 458 442 Monroe Verbal 372 367 Math 437 440 North Hollywood Verbal 415 429 Math 460 485 Reseda Verbal 341 333 Math 422 412 San Fernando Verbal 321 325 Math 389 395 Sherman Oaks Center for Enriched Studies Verbal N/A 422 Math N/A 481 Sylmar Verbal 313 326 Math 388 380 Taft Verbal 400 404 Math 496 480 Valley Alternative Verbal N/A 337 Math N/A 364 Van Nuys Verbal 473 442 Math 556 523 Verdugo Hills Verbal 351 367 Math 412 445
*--*
Note: Mean scores are not reported when 50 students or less are tested.
Sources: Los Angeles Unified School District; College Board.
(BEGIN TEXT OF INFOBOX / INFOGRAPHIC)
Non-Valley SAT Scores
*--*
Verbal Math Banning 335 387 Bell 298 358 Belmont 289 363 Bravo Medical Magnet 381 454 Carson 332 377 Crenshaw 305 343 Dorsey 302 329 Downtown Business Magnet 332 406 Eagle Rock 386 464 Fairfax 341 432 Franklin 317 379 Fremont 272 321 Gardena 348 398 Garfield 300 367 Hamilton 391 429 Hollywood 322 410 Huntington Park 308 361 Jefferson 267 336 Jordan 274 323 King-Drew Medical Magnet 325 380 Lincoln 286 387 Locke 263 329 Los Angeles 313 409 Los Angeles CES 417 442 Manual Arts 271 330 Marshall 353 428 Narbonne 392 483 Palisades 424 481 Roosevelt 292 354 San Pedro 397 463 South Gate 320 367 University 407 500 Venice 395 457 Washington Prep. 298 328 Westchester 368 400 Westside Alternative 327 299 Wilson 314 382
*--*
Note: Mean scores are not reported when 50 students or less are tested.
More to Read
Start your day right
Sign up for Essential California for news, features and recommendations from the L.A. Times and beyond in your inbox six days a week.
You may occasionally receive promotional content from the Los Angeles Times.


