How polluted is your favorite California beach? Read this report card
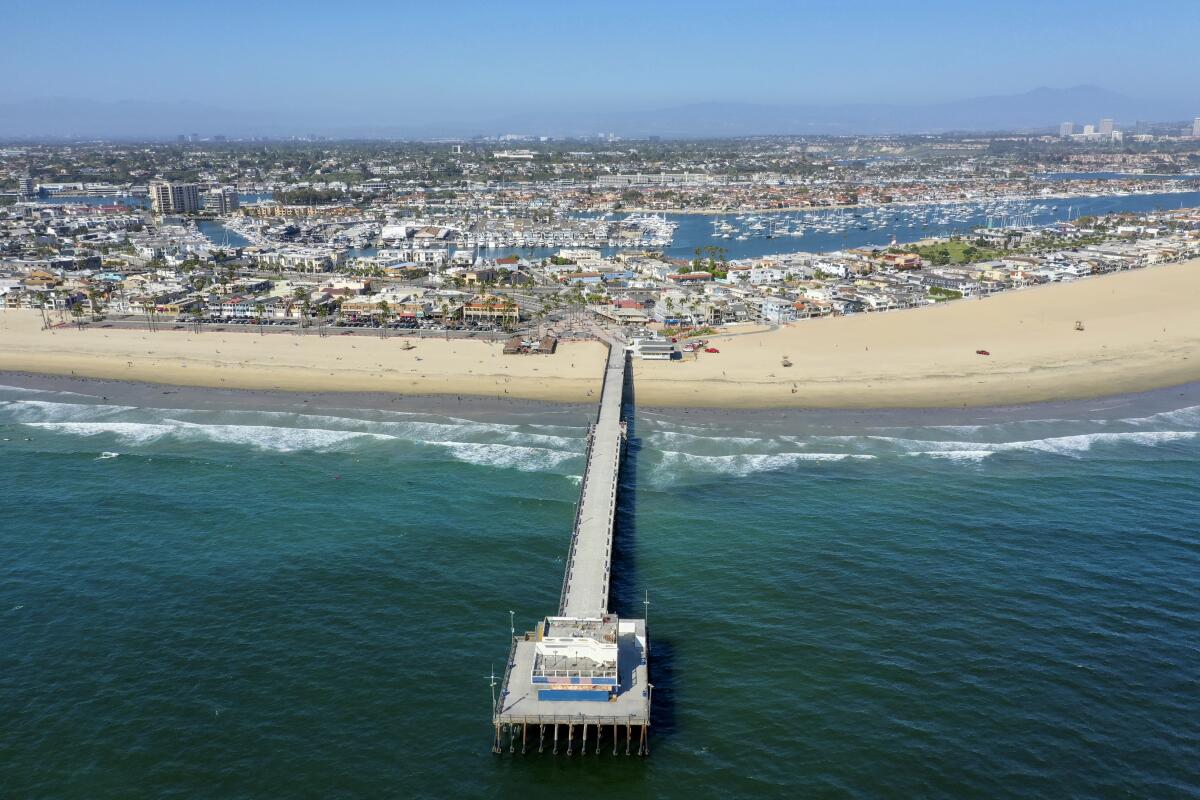
Here’s some good news (and then, some not-so-good news) for those seeking a summer respite by the sea: Beaches across California are much cleaner than in years past.
In its annual survey of more than 500 beaches, Heal the Bay reported Tuesday that 93% of California’s beaches logged good water-quality marks between April and October 2020 — an encouraging assessment for a coastline that sees all manner of trash, pesticides and bacteria (not to mention microplastics, automotive fluids and tire particles) flushed into the ocean whenever it rains.
A severe drought has meant less-polluted beaches during the summer — particularly in Southern California, where Orange County had 10 of the state’s cleanest beaches. But even a dry year has led to troubling patterns during the winter and stubborn pockets of pollution along the coast.
For the second year in a row, an unusual number of beaches in San Mateo County topped the list of dirtiest beaches in California. The environmental group also called out Mother’s Beach in Marina del Rey and other well-known trouble spots.
California beaches with the poorest water quality
1. Tijuana River mouth (San Diego County)
2. Erckenbrack Park (Foster City, San Mateo County)
3. Capitola Beach, west of the jetty (Capitola, Santa Cruz County)
4. Gull Park (Foster City, San Mateo County)
5. Mother’s Beach (Marina del Rey, Los Angeles County)
6. Tijuana Slough, 3/4 mile north of the Tijuana River (San Diego County)
7. Clam Beach County Park near Strawberry Creek (McKinleyville, Humboldt County)
8. Marlin Park (Foster City, San Mateo County)
9. Candlestick Point, Windsurfer Circle (San Francisco)
10. East Beach at Mission Creek (Santa Barbara County)
The annual beach “report card,” now in its 31st year, assigns letter grades, A+ through F, based on routine beach water-quality sampling conducted by county health officials, sanitation departments and state and tribal agencies. Water samples are analyzed for three fecal-indicator bacteria that show pollution from numerous sources, including human and animal waste.
The lower the grade, the greater the health risks: Swimming at a beach with a grade of C or lower greatly increases the risk of skin rashes, ear and upper respiratory infections, stomach flu and other illnesses.
The State Water Resources Control Board endorses this report, which has influenced significant research over the years and pushed California to become a leader in clean-water monitoring.
Analysis of these data every year helps identify patterns and locations that need closer attention.
This year’s report card, for example, showed that beaches in San Mateo County continue to experience gaps in monitoring and remediation. Last year, the county had six of the state’s 10 dirtiest beaches — four of which weren’t monitored by officials this year.
Luke Ginger, a water-quality scientist at Heal the Bay, acknowledged the challenges posed by COVID-19 restrictions but noted that no other county in California had scaled back its monitoring like San Mateo.
As for why so many beaches in the county continue to be more polluted than in others, “nobody has been able to put their finger on exactly what is going on,” said Ginger, who suggested looking for leaky pipes and investigating storm drains upstream.
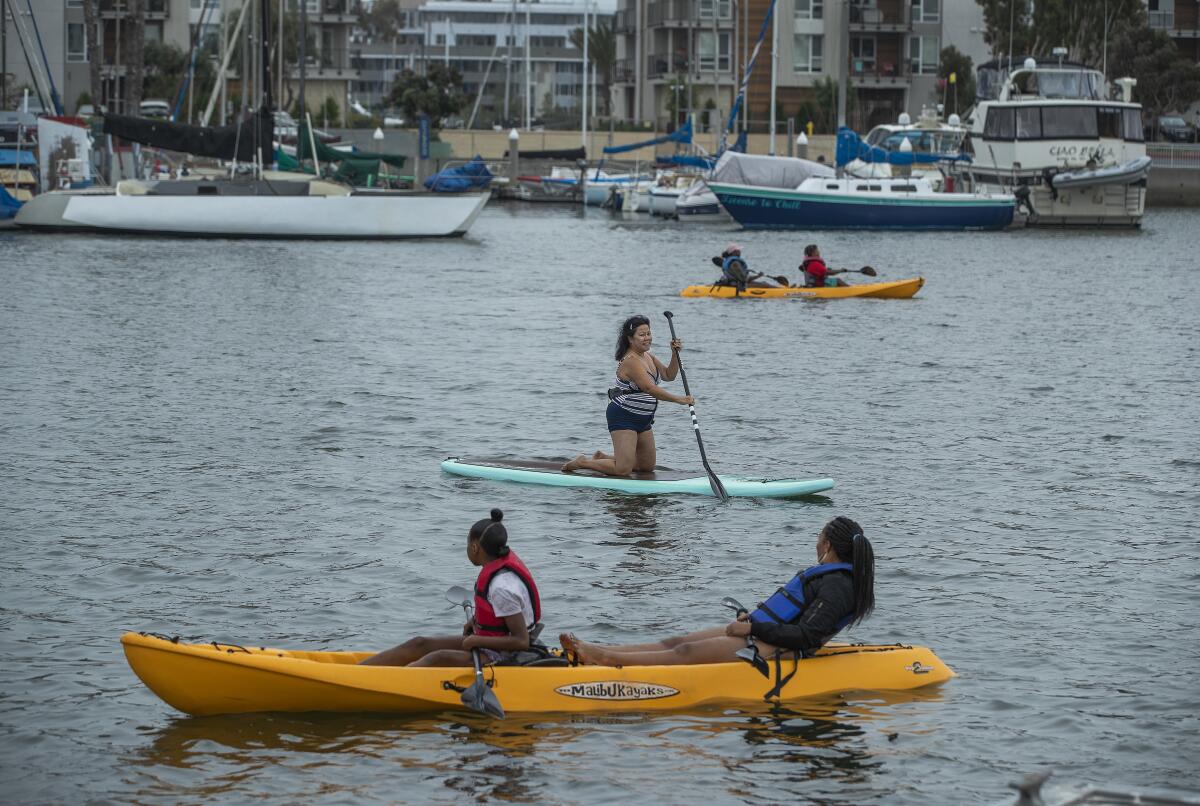
Many of these beaches — similar to Mother’s Beach in Marina del Rey — are enclosed by urbanized channels and development, he noted. Although these swimming areas are shielded from big waves (making them popular for families with young children), the poor water circulation leads to greater bacteria buildup.
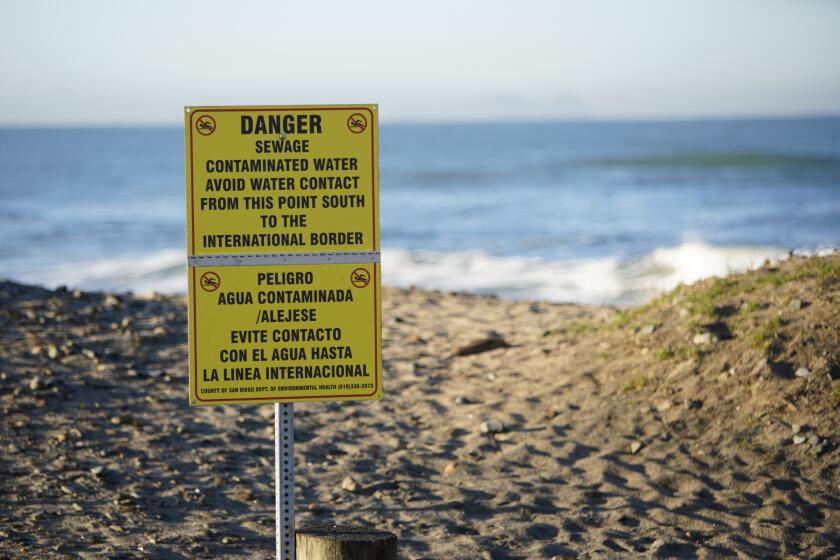
Tijuana recently finished repairs after sewage flowed over the border for weeks, shuttering beaches as far north as Coronado.
As for the Tijuana River — which starts in Mexico but enters the ocean in California, communities near the river mouth have long been frustrated with raw sewage flows. Ginger noted that failures in sewage infrastructure across the border have become so pervasive that local beaches are closed for more than 200 days each year.
“The prevailing current goes north along that stretch of coastline,” Ginger said. “So most of that sewage impacts the Tijuana Slough area and Imperial Beach — sometimes all the way up to Coronado.”
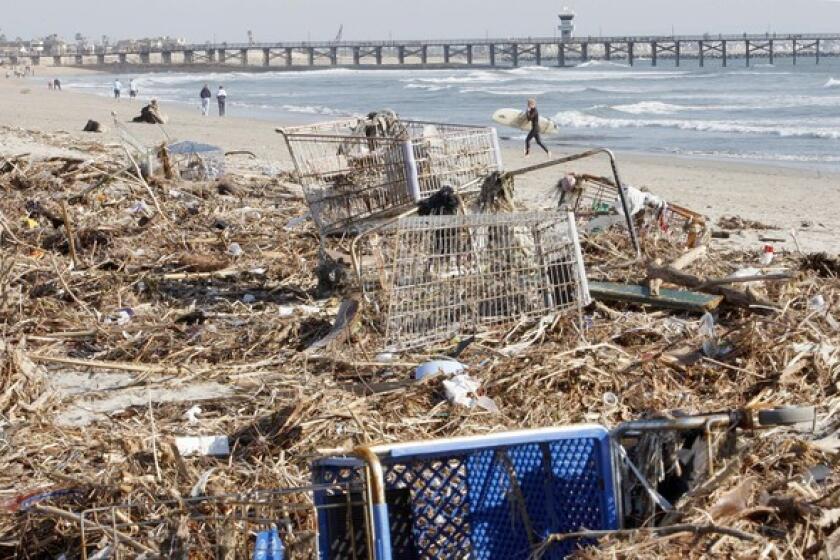
With the exception of major sewage spills, runoff from storm drains remains the largest source of pollution for California’s beaches. Unlike wastewater, which is usually filtered through treatment facilities before it’s discharged, most of this dirty water flushes straight into the ocean through a network of storm drains and concrete-lined rivers.
A good rule of thumb is to wait 72 hours after it rains before going into the ocean and to stay at least 100 yards away from storm drains, piers or enclosed beaches with poor water circulation.
After another back-to-back cold front that pelted rain, heavy snow and even a tornado warning down onto Southern California, here are some precautions and commonly asked questions about whether it’s safe to go to the beach.
As for the (often polluted) rivers that drain into the ocean, Heal the Bay on Tuesday also released its relatively new River Report Card. Now in its third year, the report builds off the beach report card — using a similar grading framework for 28 recreation sites along Malibu Creek, the Los Angeles River and San Gabriel River in Los Angeles County.
The same urban runoff polluting the ocean often starts in these seemingly fresh rivers. But unlike today’s beach monitoring, there is no statewide oversight, standardization or funding for freshwater pollution monitoring in California. Because of this data gap, people swimming in rivers are not provided the same public health information as beachgoers in California.
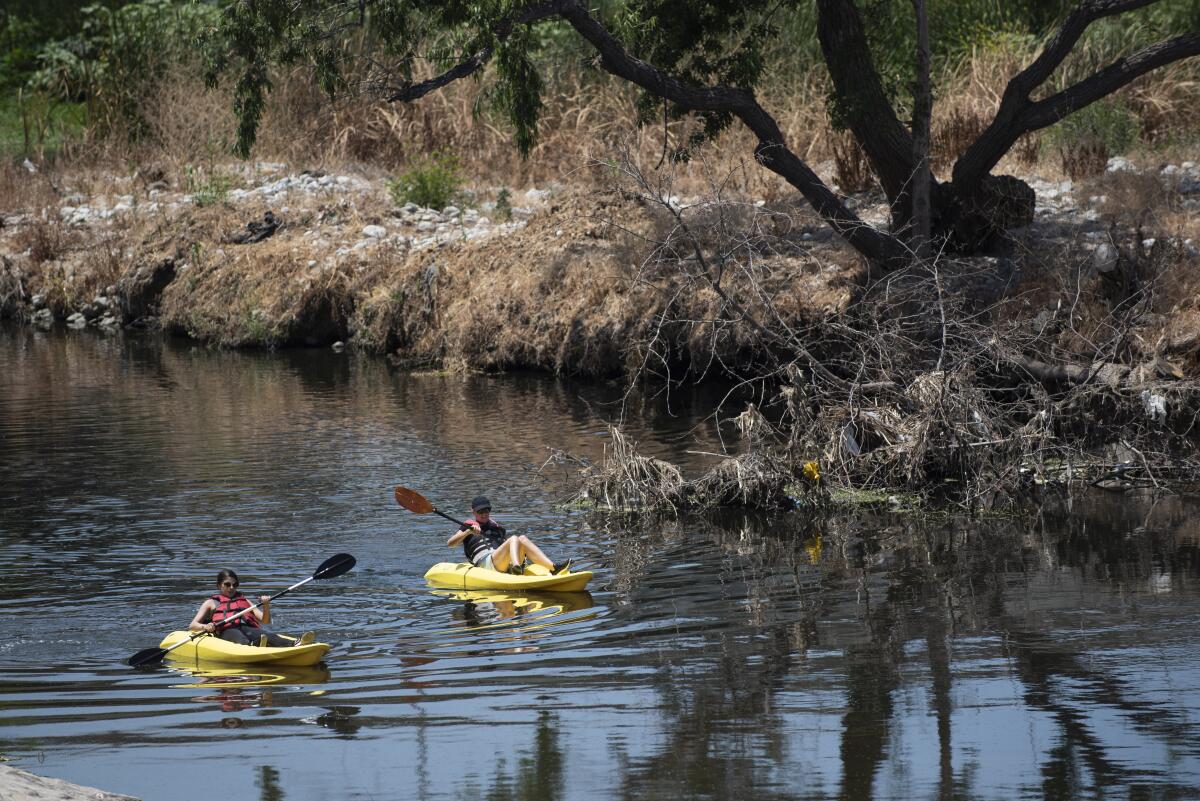
This lack of public awareness has become an increasing concern as more people turn to these bodies of water as places to swim, fish and kayak. This became particularly evident during the COVID-19 pandemic, with many cooped-up families seeking outdoor activities amid stay-at-home orders.
Here are popular river locations that pose the highest risk of illness:
1. Tujunga Wash at Hansen Dam
2. Los Angeles River at Rattlesnake Park
3. San Gabriel River, below the North and West forks
4. Los Angeles River at the middle of the Sepulveda Basin Recreation Zone
5. Bull Creek
6. Lake Balboa boat ramp
7. Lake Balboa outlet
8. Los Angeles River at Balboa Boulevard
9. Switzer Falls
Swimming in rivers today is reminiscent of what it was like to swim in the ocean three decades ago, when Heal the Bay first saw the need for a beach report card in California. Back then, surfers would get sick, especially after it rained, but few people knew when or where to avoid the beach.
Spotlighting how many beaches got poor grades each year led the state to require standardized monitoring and public advisories. The state has also funded significant research and invested $100 million in Clean Beach Initiative grants — many prioritized based on the rankings of the beach report card.
Monitoring methods and real-time reports have improved in recent years, and the survey has expanded to beaches in Oregon and Washington state. For the first time this year, the report also included three popular beaches in Tijuana, Mexico, that are regularly affected by raw sewage: El Faro, El Vigia and Playa Blanca.
Inspired by California’s transformation in beach monitoring, a bill introduced this year by Assemblyman Richard Bloom (D-Santa Monica), AB 1066, seeks to begin a similar process for lakes, rivers and streams. The legislation, which passed the Assembly earlier this month, calls for state officials to identify popular freshwater recreation sites in California that should be monitored for public health risks.
“Publicizing these report cards each year, showing our elected officials and showing the general public the places that get F grades all the time, have led to the water-quality improvements that we see today at our beaches,” said Shelley Luce, president of Heal the Bay. “Now we need to do that for rivers.”
She added, “A day at the beach or the river shouldn’t make anyone sick.”
Watch L.A. Times Today at 7 p.m. on Spectrum News 1 on Channel 1 or live stream on the Spectrum News App. Palos Verdes Peninsula and Orange County viewers can watch on Cox Systems on channel 99.
