Attendance figures that count tickets sold, not turnstile clicks, make it hard for fans to reconcile what they hear with the empty seats they see
In the eighth inning of every home game at Dodger Stadium, the public address announcer invites fans to guess the attendance. On the scoreboard above right field, four choices are displayed, with fans asked to pick the correct one.
The truly correct answer: none of the above.
In twists of semantics and accounting, the world of professional sports does not necessarily define “attendance” as “the number of people who attended the event.” That can leave fans hearing an attendance figure, staring at sections of empty seats and wondering how to reconcile what they hear with what they see.
That also can leave sponsors wondering how many people their ballpark ads are reaching and leave teams calculating how many millions of dollars they lose when fans buy tickets but don’t show up.
On July 31, with the St. Louis Cardinals -- the team with the best record in the National League -- in town, the Dodgers announced a crowd of 44,543 on a day the stands appeared closer to half-empty at the 56,000-seat stadium. They also announced attendance of 47,877 for a game three days earlier against the Cincinnati Reds, but huge chunks of the right-field pavilion and the new luxury seats beyond third base were unoccupied, with blocks of empty seats sprinkled throughout each level of the stadium.
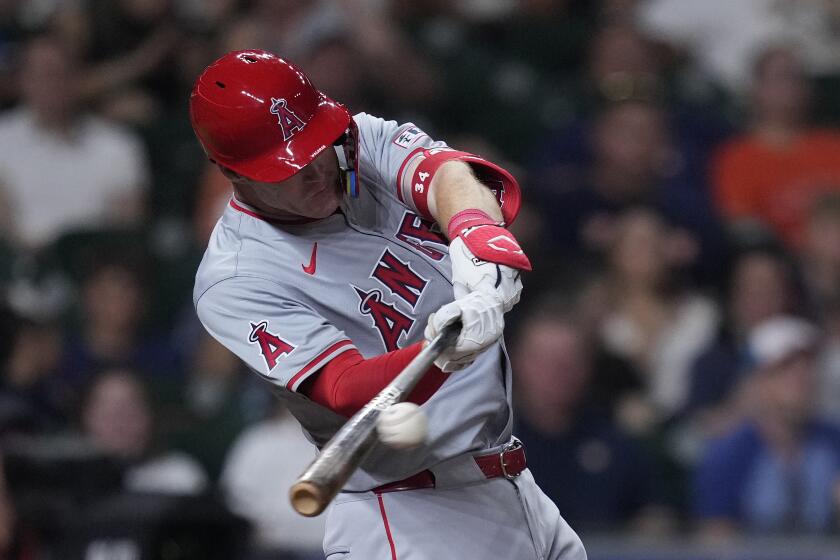
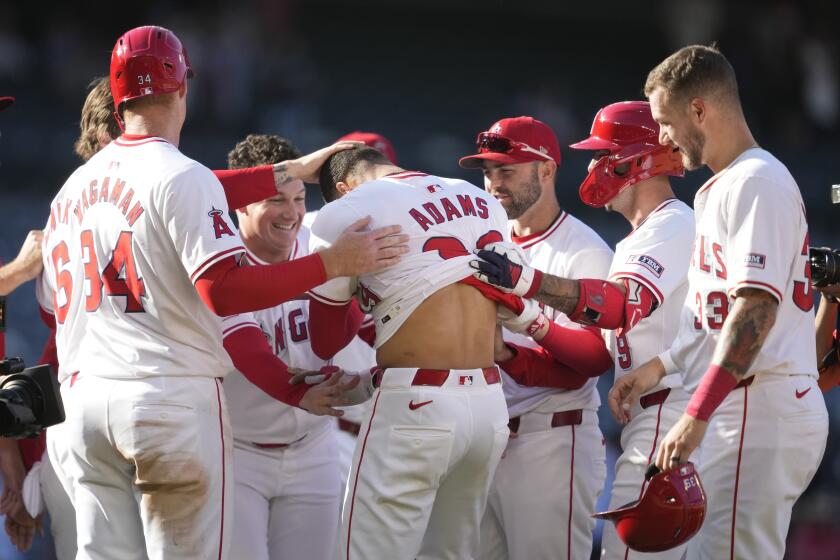
The Angels announced sellouts for each game during the Aug. 5-7 series against the last-place Tampa Bay Devil Rays, but vacant seats were not difficult to spot.
“When we say sold out, we are sold out,” said Tim Mead, the Angels’ vice president of communications.
Under the rules of Major League Baseball, the Dodgers and Angels are telling the truth.
National League teams announced an actual turnstile count through 1992, MLB spokesman Rich Levin said. But the National League and American League have since consolidated business operations, and Major League Baseball defines attendance as “tickets sold,” not “tickets used.”
“It’s because of revenue sharing,” Levin said. “That’s what we use in our official count.” (Teams contribute 34% of the revenue they generate, including most ticket and concession revenue, into a pool to be redistributed among teams that generate the fewest dollars.)
The Times no longer routinely includes attendance in sports stories, because of the discrepancies between actual and announced attendance.
“In effect, we’re intentionally presenting inaccurate information while attributing it to the home team,” Sports Editor Bill Dwyre wrote in a memo announcing the change.
The NBA and NHL announce the number of tickets distributed, adding complimentary tickets -- for players’ families, league officials, sponsors and such -- to the number of tickets sold.
The NFL traditionally has permitted a team to announce whatever attendance figures it chose, including no-shows. However, the league distributed a memo this month encouraging teams to limit their announcement to tickets sold.
“When no-shows become a significant factor,” the memo read, “clubs should respond factually to inquiries from the media.”
Major League Baseball has issued no such directive to its teams. The Dodgers declined to say how many tickets were used -- or how many unused -- for that late July homestand. They also declined to provide a no-show figure for this season, or for last season.
The Angels’ no-show rate last season -- tickets sold but not used -- was 19%, Mead said. The three weekend games last month against the New York Yankees -- the most reliable drawing card in baseball -- had no-show rates of 10%, 9% and 14%, he said.
Last year’s playoff series against the Boston Red Sox had a no-show rate of 4%, Mead said.
This year’s highest no-show rate was 40%, for an April 19 game against the Seattle Mariners, Mead said. The Angels announced attendance of 38,667 that day, meaning the actual attendance was close to 23,000.
That figure was not particularly troubling, Mead said, because the game took place on a Tuesday afternoon in April, when school and work commitments can make it difficult for season-ticket holders to use, sell or give away their seats.
The Dodgers’ no-show rate this season is running about even with last season, Chief Operating Officer Marty Greenspun said. The large number of empty seats during the games against St. Louis and Cincinnati, he said, simply reflected the reality of playing in the afternoon during a heat wave.
“If they would have been night games, the no-show factor would have been a lot less,” he said. “It’s not a function of anything but the weather. It was 100 degrees out.”
The average major league no-show rate hovers between 18% and 20%, an executive from another National League team said. And, in order to add 1,600 field-level luxury seats this season and still comply with a city permit that limits capacity to 56,000, the Dodgers no longer sell 1,600 reserved-level seats.
If the Dodgers’ no-show rate for the July 28 weekday game against Cincinnati matched the highest rate of the Angels, the Dodgers’ actual attendance would have been 28,726 -- a half-empty stadium.
The local teams are on pace to set franchise records in tickets sold, the Dodgers at 3.7 million and the Angels at 3.4 million. The teams each won division championships last season and recorded an increase in season-ticket sales this season -- the Angels to a record 28,400 and the Dodgers to 23,000.
The greater the number of season tickets sold, the greater the number of no-shows, Mead and Greenspun said.
In an effort to minimize no-shows, the Dodgers and Angels now allow season-ticket holders to resell seats on the team website. The teams also use bar codes to scan tickets, and Greenspun said the Dodgers contact customers who use season seats infrequently and offer incentives to attend.
With good reason, said David Carter, a Los Angeles sports business consultant. When fans are no-shows, the team makes money on the sale of the ticket but loses the chance to make more money at the concession and souvenir stands.
“They’re not eating any hot dogs or guzzling the $8 beers,” Carter said.
Fans spend an average of $16 on food, drinks, merchandise and parking, Mead said. That 40% no-show game in April, then, translated to a loss of about $250,000 in Angel Stadium sales.
The Angels lost roughly $10 million in stadium sales last season, based on the 19% no-show rate and 3.38 million tickets sold. (The Dodgers would have lost slightly more, based on that rate. That figure represents gross revenue, before subtracting salaries, costs and revenue-sharing contributions.)
The Dodgers and Angels also make millions each year by selling advertising, including signs along the outfield wall, space on promotional giveaways such as caps and T-shirts, and commercial time on stadium video boards. The teams pitch potential advertisers on the ability to reach more than 3 million fans, based on announced attendance.
Robert Alvarado, the Angels’ director of marketing, said some sponsors pay the team an incentive bonus if attendance exceeds a specified level.
“We have one or two sponsors who really inquire about our attendance numbers, even though they’re published every day in the paper,” he said.
But because of the no-show factor, the figures published in box scores do not reflect how many people actually see a stadium advertisement. Still, Alvarado said, he has not received a call from sponsors alarmed after seeing a sizable block of empty seats on television and curious about exactly how many people have seen their ads.
“We’re not really selling every person that comes through the gates,” Alvarado said. “We’re pitching the average attendance. We’re pitching a three-year run of over 3 million in attendance and being in the top five in baseball.
“They’re not really looking at a specific game.”
In addition, he said, many sponsors buy packages that include ads at the ballpark but also on schedules, posters, promotional giveaways and radio and television broadcasts, so the target audience is not limited to fans in attendance.
Still, sponsors need to be aware the attendance they pay for might not be the attendance they get, said Chris Smith, chief strategy officer at the Marketing Arm, a Dallas-based company that matches advertisers with sports and entertainment properties.
“It’s not an baseball-only problem,” Smith said. “Most sponsors go off what the team gives them. When we evaluate sponsorships for our clients, we take into account a slippage rate for attendance.”
The no-show issue could become ominous for the Dodgers, if increasing numbers of empty seats over the last two months of a poor season foretell a winter in which fans opt not to renew season tickets and advertisers opt not to renew sponsorships.
The Dodgers are not overly concerned, Greenspun said. Fan loyalty tells a better story, he said, than a few empty sections of Dodger Stadium on any given day.
“We’ve got a long-term history of having more years with 3 million fans than any other team,” he said. “Historically, we’ve got the best fan base in the country.”
*
Times staff writers Sam Farmer and Jerry Crowe contributed to this report.
*
No-showmanship
The Angels sold out three weekend games in last month’s series against the New York Yankees, including an announced crowd of 44,035 on July 23, above. But the announced attendance -- tickets sold -- differed for each game, as did the actual attendance. Complimentary tickets are not included in either count. The Angels list stadium capacity as 45,050.
Date Announced crowd Actual attendance No-show factor July 22 44,043 39,771 9.7% July 23 44,035 39,994 9.2% July 24 44,032 37,885 14%
Source: Angels
**
Baseball attendance
Major league attendance figures through Aug. 21, sorted by home and road averages. Figures are for tickets sold:
AMERICAN LEAGUE
HOME ROAD
GAMES GAMES
Dates Total Avg Dates Total Avg New York 61 3,037, 49,791 61 2,301, 37,724
270 190 ANGELS 65 2,738, 42,125 58 1,848, 31,868
152 323 Boston 56 1,969, 35,166 66 2,554, 38,707
286 646 Seattle 62 2,116, 34,140 61 1,695, 27,801
650 870 Baltimore 61 2,011, 32,978 62 1,876, 30,272
669 865 Texas 58 1,907, 32,892 65 1,833, 28,201
736 089 Chicago 64 1,880, 29,387 57 1,647, 28,908
792 736 Detroit 61 1,641, 26,914 59 1,538, 26,068
774 009 Minnesota 62 1,638, 26,427 62 1,786, 28,810
479 237 Oakland 65 1,698, 26,125 58 1,721, 29,685
117 738 Toronto 59 1,438, 24,385 64 1,813, 28,336
727 523 Cleveland 63 1,514, 24,039 61 1,836, 30,103
441 310 Kansas City 59 1,100, 18,647 62 1,601, 25,825
185 157 Tampa Bay 62 880,751 14,206 62 1,743, 28,121
530 AL Totals 858 25,574 29,807 858 25,798 30,068
,029 ,223
NATIONAL LEAGUE
HOME ROAD
GAMES GAMES
Dates Total Avg Dates Total Avg DODGERS 59 2,725, 46,191 64 2,089, 32,645
297 249 St. Louis 66 2,857, 43,303 58 1,803, 31,093
985 388 San 58 2,273, 39,199 64 2,043, 31,925 Francisco 522 169 Chicago 59 2,297, 38,935 64 2,323, 36,297
181 034 San Diego 59 2,148, 36,417 63 2,045, 32,469
624 567 New York 64 2,304, 36,005 58 2,064, 35,589
314 143 Houston 64 2,203, 34,424 59 1,800, 30,509
126 020 Washington 56 1,898, 33,904 68 2,271, 33,399
597 120 Philadelphia 67 2,257, 33,699 57 1,628, 28,571
839 547 Atlanta 62 1,975, 31,862 62 2,035, 32,828
428 313 Milwaukee 56 1,583, 28,280 69 2,095, 30,367
660 299 Arizona 59 1,528, 25,902 65 2,159, 33,226
209 666 Cincinnati 69 1,708, 24,758 55 1,812, 32,946
283 026 Colorado 67 1,620, 24,188 56 1,744, 31,155
563 672 Pittsburgh 56 1,350, 24,119 67 2,212, 33,023
652 547 Florida 65 1,487, 22,882 57 1,868, 32,784
340 666 NL Totals 986 32,220 32,678 986 31,996 32,451
,620 ,426
Go beyond the scoreboard
Get the latest on L.A.'s teams in the daily Sports Report newsletter.
You may occasionally receive promotional content from the Los Angeles Times.


