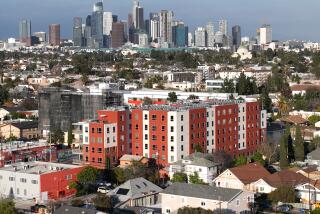
News from the multiple-family housing permit front...
- Share via
News from the multiple-family housing permit front was mixed in October, the latest month for which information is available. The 752 permits issued during the month pretty much kept pace with September (779) and was ahead of the 1989 monthly average (717). However, fewer permits were issued this October than in any of the past four. And the 1989 10-month total is well below 1988 (30% fewer), 1987 (-50%) and 1986 (-41%).
Major decreases in the cities of Costa Mesa, Tustin and Irvine as well as in the unincorporated areas highlight the year-to-date decline and offset those gains in permits issued for Fullerton and Mission Viejo.
Jan.-Oct. Jan.-Oct. 1988-’89 City 1988 1989 Difference Costa Mesa 827 31 -796 Tustin 707 111 -596 Unincorporated areas 3,908 3,370 -538 Irvine 761 261 -500 Yorba Linda 296 0 -296 Huntington Beach 525 263 -262 San Clemente 403 151 -252 Santa Ana 418 196 -222 Brea 236 17 -219 Fountain Valley 71 0 -71 Los Alamitos 66 10 -56 Westminster 97 42 -55 Anaheim 1,297 1,256 -41 Placentia 74 47 -27 Cypress 42 20 -22 La Habra 41 20 -21 Laguna Beach 15 2 -13 La Palma 0 0 N/C Seal Beach 0 0 N/C Villa Park 0 0 N/C San Juan Capistrano 0 4 +4 Buena Park 131 139 +8 Garden Grove 180 192 +12 Stanton 7 22 +15 Orange 45 68 +23 Newport Beach 154 200 +46 Fullerton 42 388 +346 Mission Viejo ** 0 361 +361 Dana Point * -- 30 -- COUNTY TOTAL 10,343 7,201 -3,142
* New city for 1989 tabulations; 1989 data is for four months only (July-October), 1988 data included in “Unincorporated areas” total. ** New city in 1988 tabulations; 1988 data is for only four months (July-October) N/C: No change 10-MONTH ANNUAL COMPARISON 1986: 12,292 1987: 14,382 1988: 10,343 1989: 7,201 5-COUNTY COMPARISON The 30% decline in the number of multiple-family home permits issued in Orange County during the first 10 months of the year was no abberation in urban Southern California. All four of the neighboring counties also registered year-to-date drops, with San Diego County’s 56% decrease by far the largest. Despite the drop-off, two-thirds (65%) of all such permits issued this year in the entire state have been for Orange (12%) or the surrounding four counties.
% of 1989 % of 1989 Jan.-Oct. Jan.-Oct. Percentage 5-County State County 1988 1989 Difference Total Total Los Angeles 26,704 19,803 -26 51 33 Orange 10,343 7,201 -30 19 12 Riverside 4,678 3,117 -33 8 5 San Bernardino 3,844 3,647 -5 9 6 San Diego 11,786 5,221 -56 13 9 Five-County Total 57,355 38,989 -32 100 65 STATE TOTAL 77,743 60,405 -22 -- 100
Source: Construction Industry Research Board


