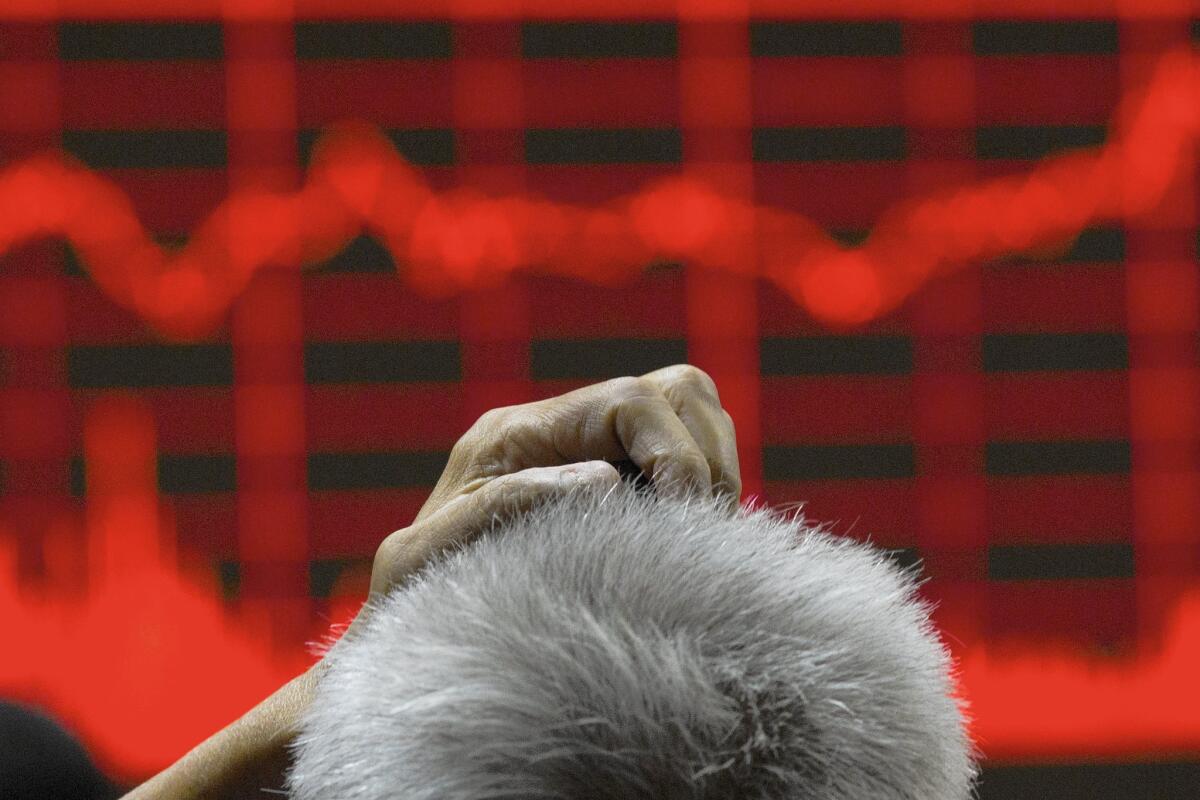
Historical volatility points to more wild rides ahead for the stock market

- Share via
To get a handle on how volatile stocks are right now, take a look at a chart of the S&P 500 on Friday. Sixteen different times the index reversed ground and swung 1%, en route to the biggest rally in a decade.
While the comparison is imperfect, the benchmark recently went a whole year without notching 16 days in which it rose or fell 1%, close-to-close. Only twice in a decade-long bull market did the S&P 500 swing more in a month than it did on either Thursday or Friday.
Then there’s the history of giant gains like Friday’s. The last time shares surged that much — more than 9% — markets were smack in the middle of October 2008, the worst month in 33 years, when the S&P 500 finished down 17%. The last time stocks dropped 9% in one session then jumped 9% in the next? 1931, another inauspicious year.
So while Wall Street traders were glad to finish last week on an up note, with the biggest jump since 2008, very few were ready to call an end to the turbulence.
Indeed, immediately after the Federal Reserve Board announced a series of shock moves Sunday to cushion the U.S. economy from the coronavirus shutdown, S&P 500 stock futures started falling. They were down 4.8% as of 6:17 p.m. in New York, pointing to another tumultuous trading day on Monday.
“We tend, in the midst of bear markets, in these crises, to see big, big swings like this, both on the downside and the upside,” said Jennifer Ellison, principal at San Francisco-based wealth-advisory firm BOS. “We get this self-fulfilling prophecy. When markets are down and they start to spiral, everybody wants to run for the exits. And then they think they missed out on the bottom and they run back in.”
More stats to ponder: The S&P 500 fell on three days last week and rose on two, with each move exceeding 4%. That also hasn’t happened since the Depression, in 1929. The benchmark index jumped 9.3% on Friday after President Trump declared a national emergency to help combat the virus. That followed a 9.5% drop the previous day, when his travel ban and tepid fiscal measures disappointed traders.
Valuations may have set the stage for a rebound. After Thursday’s pummeling, the S&P 500 traded at 15 times last year’s profits. Even if you assume an income decline typical of a recession, the index’s price-earnings ratio would come out to 17.5 — just about average for the last 30 years.
“A day like today is recognition that notwithstanding the issue of both coronavirus and what’s going on with Saudi Arabia and Russia, parts of the market appear to be oversold,” said Mark Stoeckle, chief executive officer of Adams Funds. “People are looking and saying: How much of the downdraft has been a result of real economic changes versus fear?”
But Goldman Sachs Group threw cold water on any such hopes, issuing a note to clients that if the economic fallout from the spreading coronavirus deepens, the rout can take the S&P 500 down another 26% from Friday’s close, to 2,000.
The firm’s U.S. chief equity strategist, David Kostin, warned that the spreading coronavirus will damage profits and harm the economy to an unpredictable extent as governments scramble to contain the outbreak and companies face forced interruptions to their businesses.
“The coronavirus has created unprecedented financial and societal disruption,” he wrote.
Even after Friday’s rally, the S&P 500 ended the week lower by 8.8% and down 20% from its record. For Kostin’s call to come true, the rout from the Feb. 19 high record would swell to 41% and wipe out all the gains booked during Trump’s presidency.
Kostin also believes, though, that V-shaped recoveries in stocks usually follow “event-driven” bear markets. He expects the S&P 500 to end 2020 at 3,200 — a 60% rally from 2,000.
“The lesson of prior event-driven bear markets is that financial devastation ultimately allows a new bull market to be born,” he writes.
Something approaching terror was visible on Thursday, though, when waves of selling sent the CBOE Volatility Index, or VIX, to its highest point since 2008. Turns out the gauge has never hit such an extreme point without the S&P 500 “immediately and sharply” bouncing by more than 10% over the next day or two, according to Nicholas Colas, co-founder of DataTrek Research.
The VIX closed Thursday above 75, a level surpassed by only three other dates — all of them notched in 2008.
“It’s been a wild ride all week,” Quincy Krosby, chief market strategist at Prudential Financial Inc., told Bloomberg TV. “We saw indiscriminate selling all week long. That’s a good thing because it’s telling you that we’re reaching a panic level. And we always like to say: Try to look for peak panic. Have we gotten there yet? Maybe not yet.”
More to Read
Inside the business of entertainment
The Wide Shot brings you news, analysis and insights on everything from streaming wars to production — and what it all means for the future.
You may occasionally receive promotional content from the Los Angeles Times.


