Rainfall season was a ‘roller coaster ride’ when two wettest months turned dry
- Share via
The 2019-20 rainfall season that ended on June 30 was nearly average for most of Southern California, but was far from normal.
Downtown Los Angeles ended up with 14.88 inches of rain for the period from July 1 to June 30, the historical meteorological rainfall season. This falls slightly short of the mathematical average of 14.93 inches, but nonetheless earns a 100% of normal score for the city.
Other Southern California locations got even better report cards. Thermal, for example, received 193% of normal; Lancaster got 145% of normal; and San Diego got 132%.
Northern California didn’t fare nearly as well. Crescent City, which expects to receive 64.03 inches of rain in a year, got only 44.87, or 70% of normal. San Francisco and San Jose got 49% of normal, and Livermore got just 41% of normal.
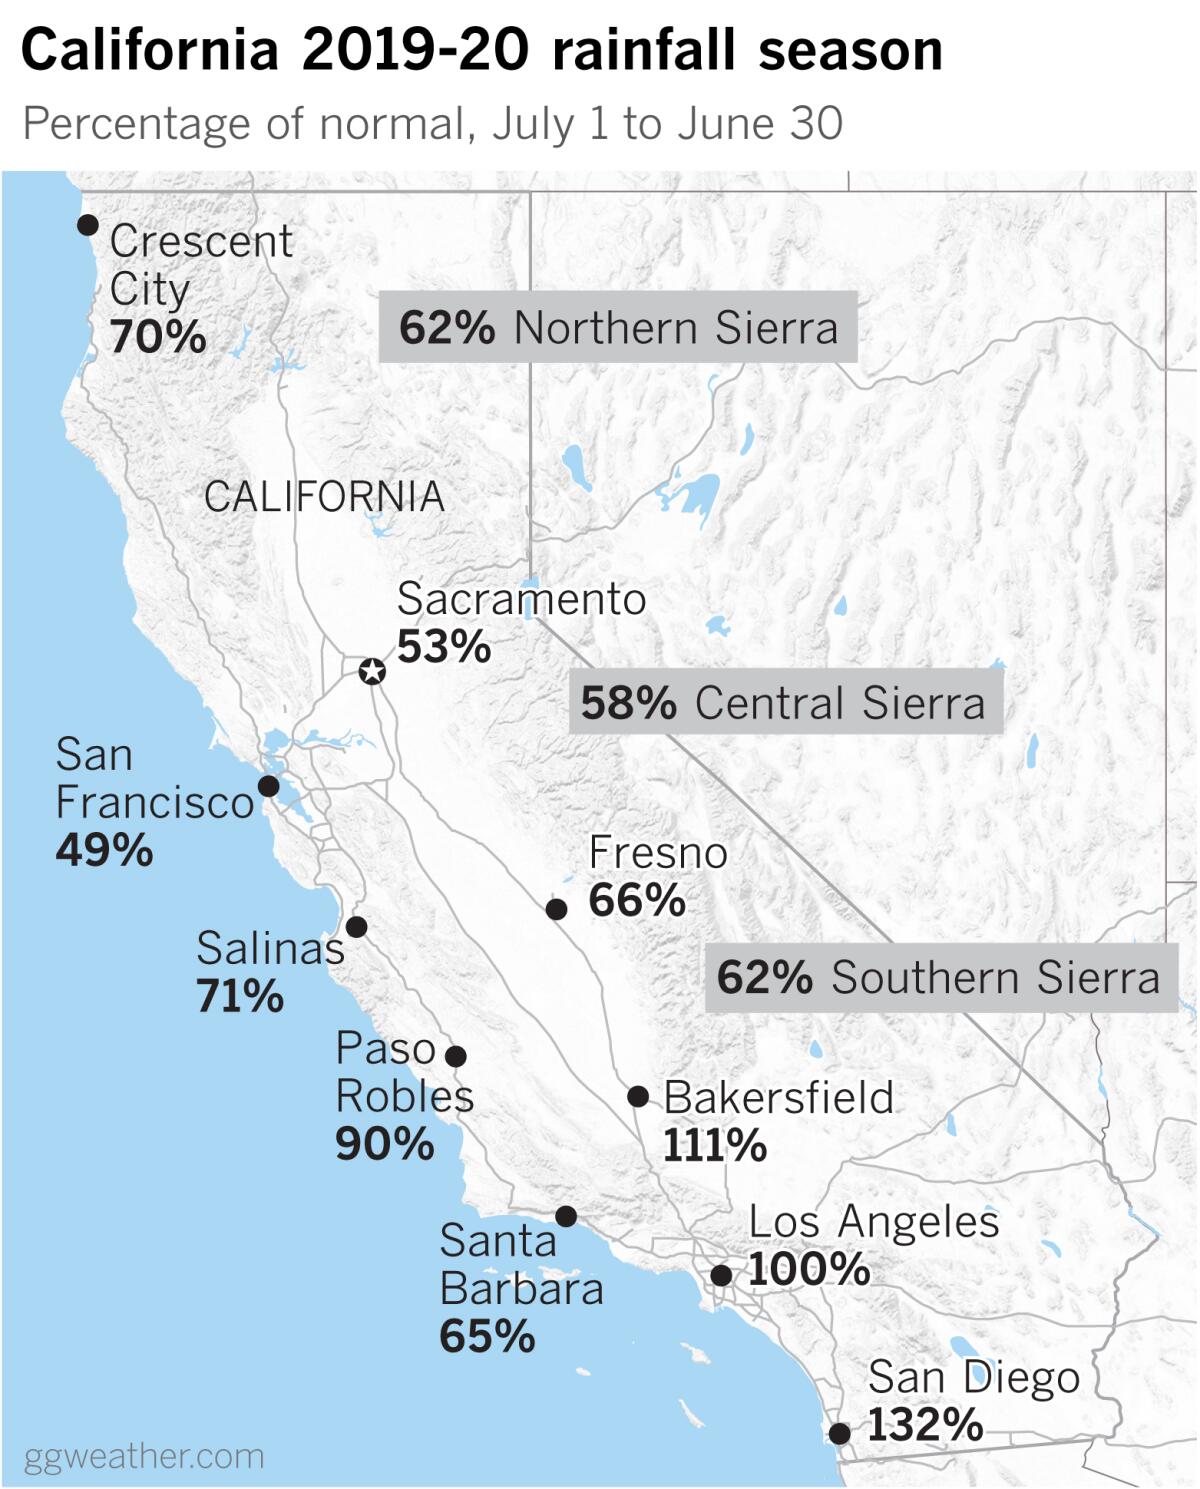
The critically important Northern Sierra 8-Station Index got 62% of normal precipitation, based on the 1981-2010 30-year average.
The index is the average of eight precipitation measuring sites that provide a representative sample of the Northern Sierra’s major watersheds. These watersheds include the Sacramento, Feather, Yuba and American rivers. These rivers flow into some of California’s biggest reservoirs, providing a large portion of the state’s water supply.
Southern California benefited from wet, late-season storms and Northern California didn’t enjoy as much relief. The northern part of the state also got a late start on rainfall last autumn, putting it behind the eight ball. The entire state endured a lengthy midwinter dry spell but Southern California received unseasonable winter-like storms in the spring.
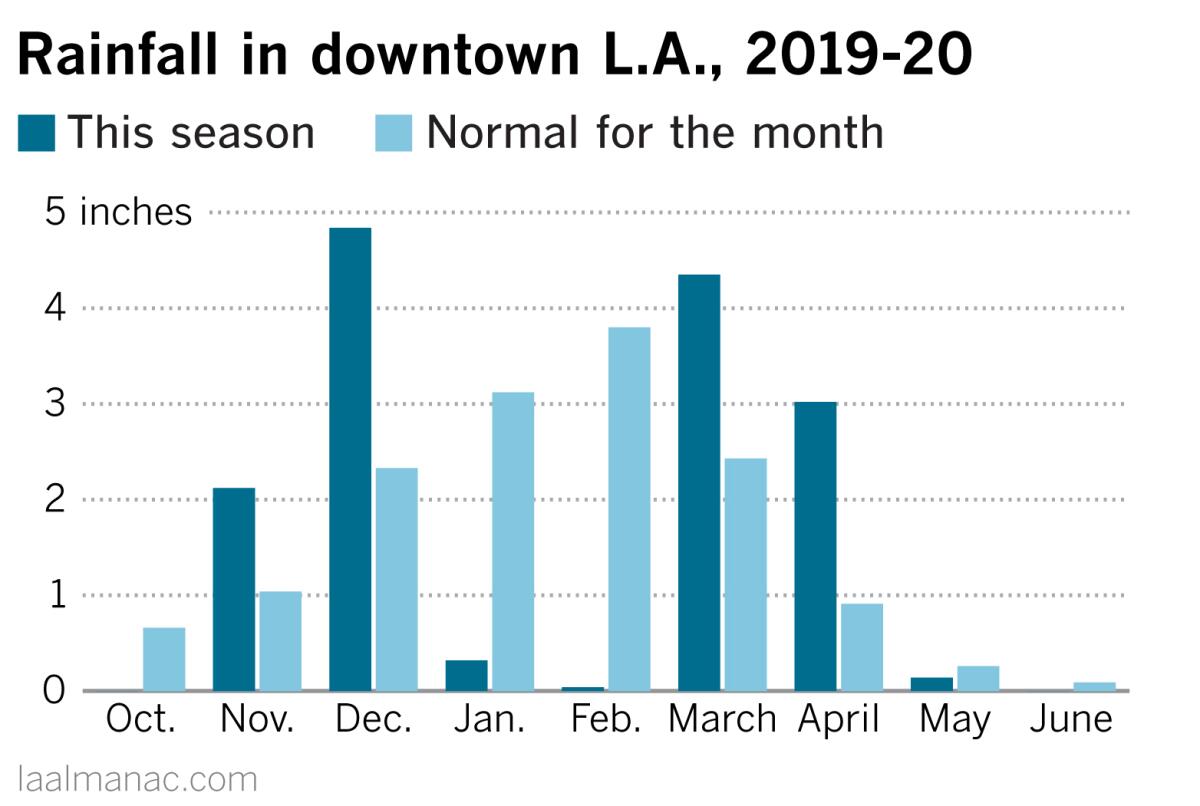
Downtown Los Angeles got about double its normal rainfall in November and December, climatologist Bill Patzert points out. “Then it got double-bageled in January and February, usually the two wettest months,” he said. After that, about twice the normal rainfall fell again in both March and April.
“Definitely a roller coaster rainfall ride,” said Patzert.
That roller coaster is reflected in longer-term rainfall patterns as well.
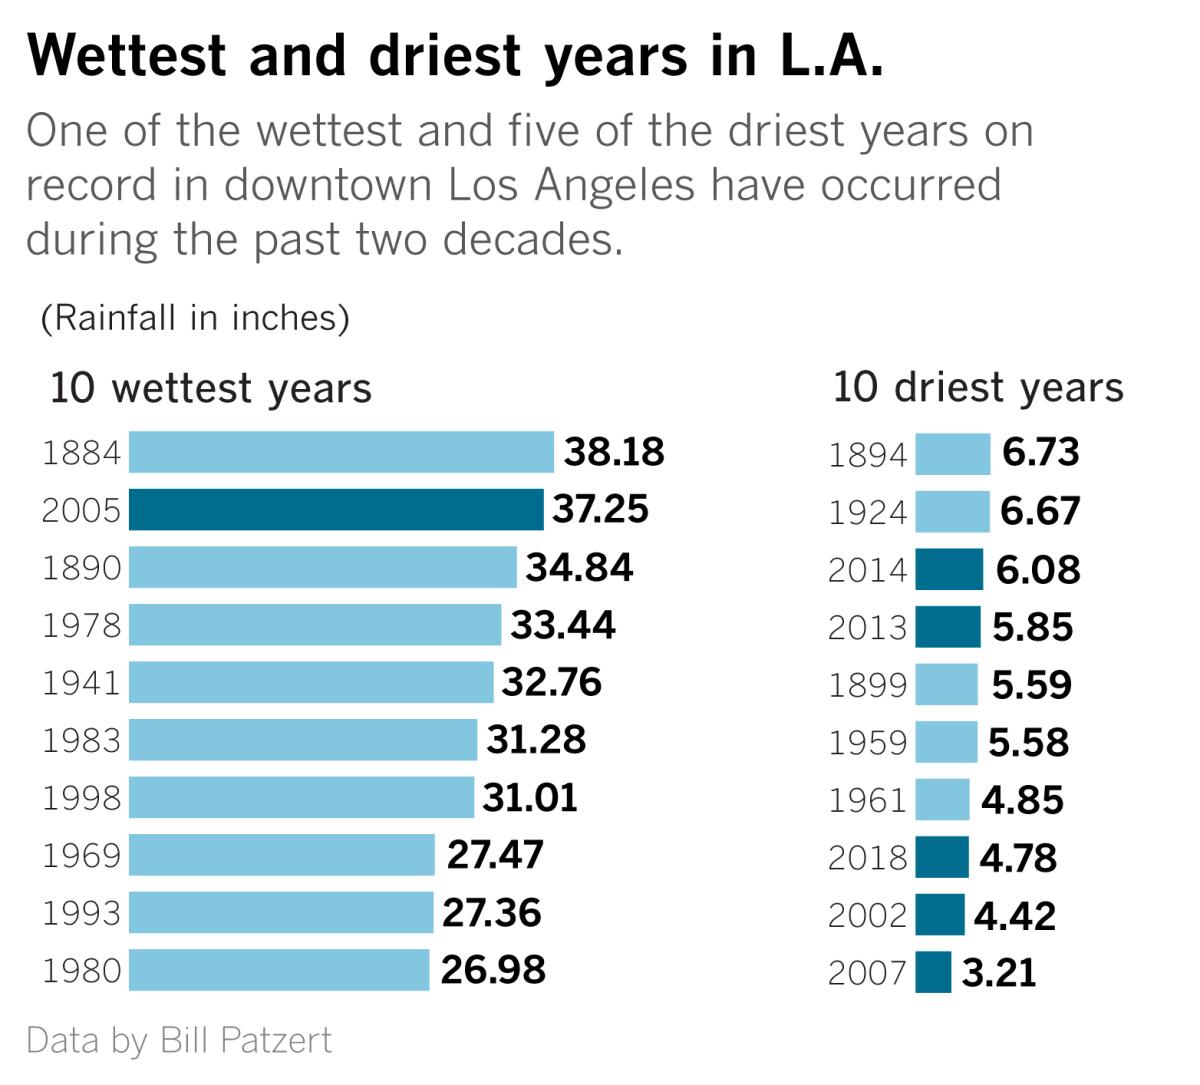
Looking at downtown Los Angeles over the last 22 rainfall seasons, seven seasons have been above average and 15 have been below. That means nearly 70% of years were below average for rainfall during the period. That stretch of years includes one of the wettest years and five of the driest years on record.
This illustrates Patzert’s point that droughts tend to be “long, large and intermittent. You think you’re out, and you’re back in again.” Citing the long-term nature of drought, he says, “There’s no quick fix — one wet year doesn’t get you out.”
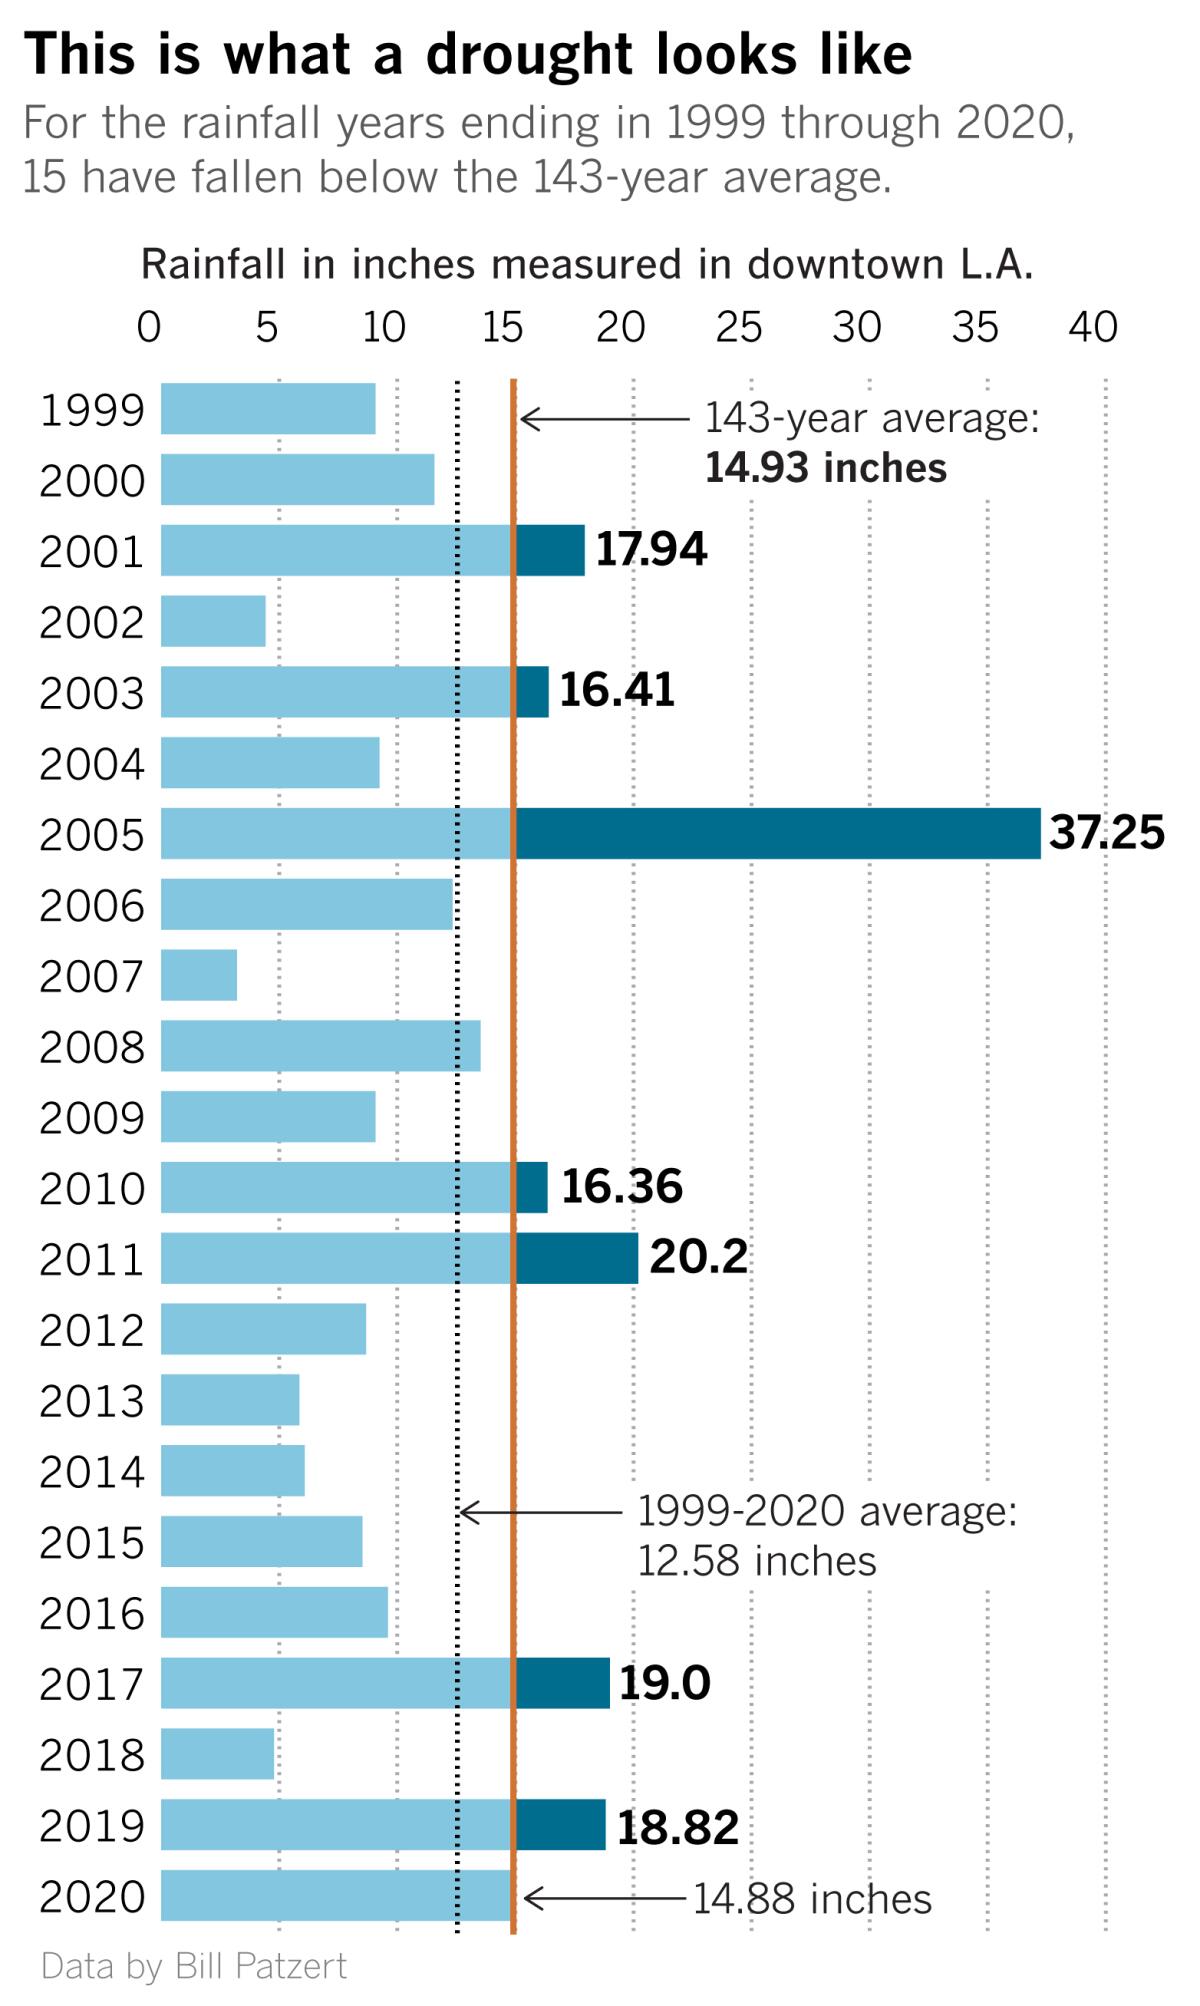
Stepping back even further, the last 22 dry years in downtown Los Angeles are part of a bigger, decades-long undulating roller coaster. From about 1999 to 2020, downtown L.A. has averaged about 12.6 inches of rain a year, which is below average. Before that, `from about 1978 to 1998, L.A. was in a wet cycle, when downtown averaged about 17 inches annually — above average. But that wet period was preceded by a stretch of years — from about 1945 to 1977 — when L.A. endured a prolonged dry spell., during which the annual rainfall averaged about 12.9 inches.
There are intermittent dry and wet years during these longer periods, adding to the roller coaster effect. Overall, the difference between a wet or dry period is plus or minus about 15% of precipitation, on average. So, Patzert explains, a drought doesn’t necessarily mean that your rainfall is suddenly cut back by 50% in one year; rather, it’s an average of about 15% or 16% less each year over a long period of time.
During the 1978-98 wet period, Lake Mead, the reservoir behind Hoover Dam on the Colorado River, filled to the brim. Eventually, excess water had to be released in 1998. Now, with an extended dry period in place in the Southwest since about 1999, the water level in Lake Mead is low again. The lake takes about 17 years to fill. Patzert says Lake Mead is a faultless indicator of drought in the southwestern U.S.
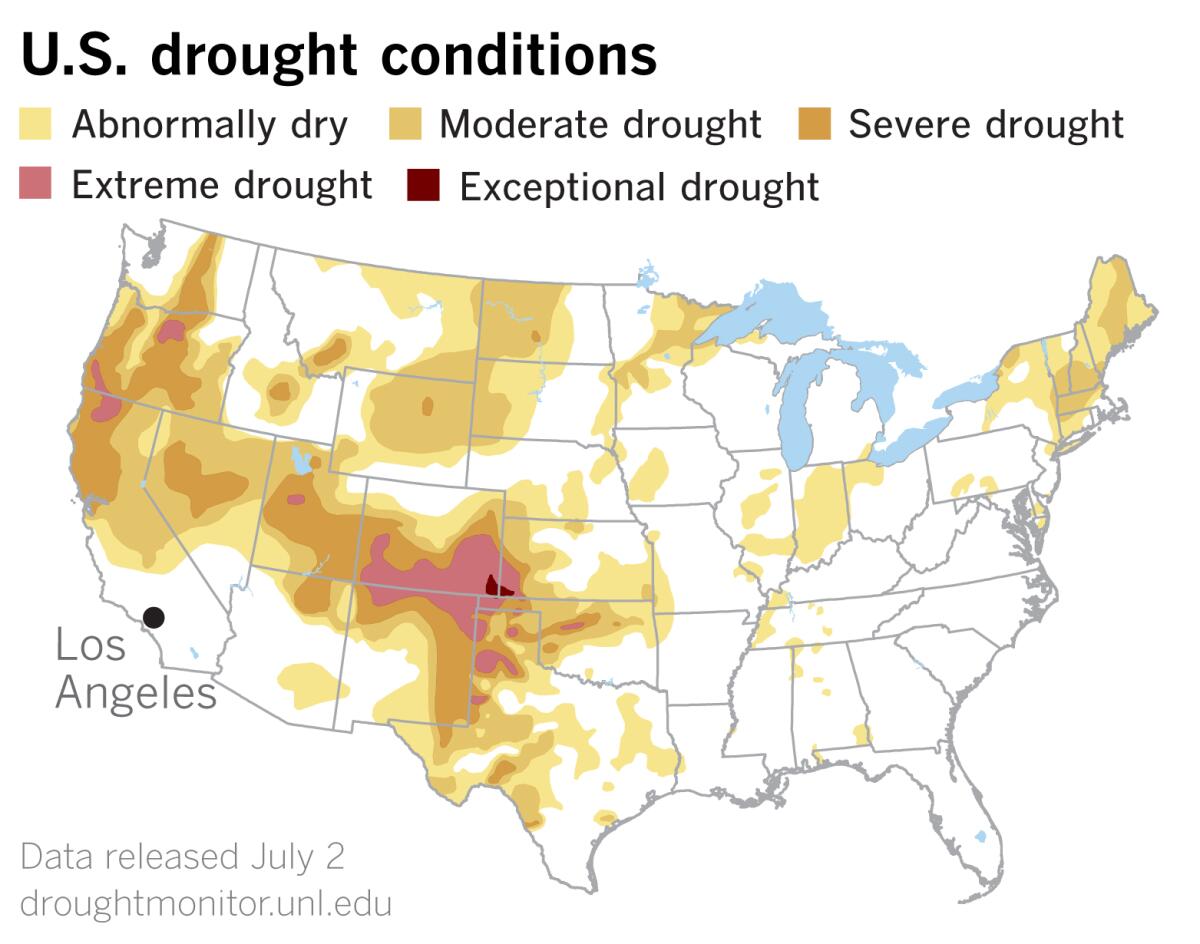
The latest U.S. Drought Monitor data released Thursday shows little change in Northern California and the Pacific Northwest, but drought is clearly expanding in large portions of the West. Soil moisture and stream flows are below normal, particularly in the Great Basin, Northern California and the Four Corners region.
A look at the map shows drought well established in the U.S. west of the Mississippi River.
“A skimpy snow year in the Sierra impacts the entire state,” Patzert said, referring to the major reservoirs fed by snow melt. Even though many spots in the southern part of the state came in at about average for 2019-20, it wasn’t a normal year. Unfortunately, Patzert says, “an average rainfall year in Southern California just means more fuel for the fire season.”
More to Read
Sign up for Essential California
The most important California stories and recommendations in your inbox every morning.
You may occasionally receive promotional content from the Los Angeles Times.


