Vehicle crash death rates are lower in urban areas, CDC says
- Share via
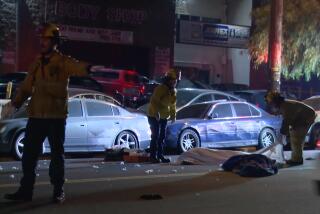
Maneuvering a 4,000-pound machine made of aluminum and steel at highway speeds leaves little room for human error and more than enough room for the possibility of danger. So perhaps it should come as little surprise that motor vehicle crashes remained a leading cause of death in the United States in 2009. According to a new report, they accounted for 34,485 deaths.
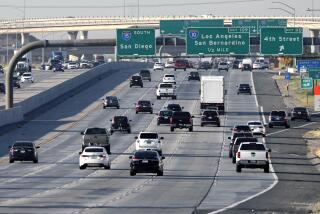
The new data, released by the National Center for Injury Prevention and Control at the Centers for Disease Control and Prevention, found that urban areas like Los Angeles and New York had lower death rates due to car crashes than rural areas. This means that urban development is associated with fewer fatal motor vehicle crashes.
The country’s 50 most populous urban areas – known officially as metropolitan statistical areas – are home to 54% of the nation’s population yet account for only 40% of motor vehicle deaths. Put another way, the overall death rate in these urban areas was 8.2 per 100,000 residents, which is lower than the national rate of 11.1 per 100,000 residents.
Much of this gap can be explained in two words, the CDC researchers said: urban sprawl.
Despite its name, urban sprawl is less common in urban areas than in rural ones. It’s also more common in Southern states.
Even within metropolitan statistical areas, or MSAs, there was a noticeable gap between cities and the more rural areas adjoining them. Within the 63 cities contained in the 50 biggest MSAs, the death rate due to car crashes was 7.9 per 100,000 residents, slightly lower than the 8.2 per 100,000 rate seen in the metropolitan areas as a whole, the researchers reported.
“These findings are consistent with statistics showing that motor vehicle crash death rates are lower in urban areas than in rural areas,” they wrote in Friday’s edition of the CDC’s Morbidity and Mortality Weekly Report.
The death rate in Los Angeles was slightly below average, at 7.7 per 100,000 residents. The safest areas included New York City, San Francisco, Oakland and the greater Cleveland and Boston areas, none of which exceeded 5 deaths per 100,000 residents in 2009.
On the flip side, Memphis, Tenn., Orlando, Fla., Miami and Glendale, Ariz., all had death rates above 16 per 100,000 residents.
The data also confirm the popular notion that younger drivers are more dangerous behind the wheel. Nationwide, the motor vehicle death rate for people between the ages of 15 and 24 was 17.3 per 100,000 residents, compared with 11.1 per 100,000 for Americans of all ages.
But once again, these teens and young adults were safer in urban areas — the death rate was 13.0 per 100,000 in MSAs and an even lower 10.9 per 100,000 in the major cities, according to the CDC report.
What implications does this have for the future of motor vehicle safety? It shows a need to factor car-related death rates into urban development and planning, the study authors wrote.
Moreover, the country should continue its efforts to reduce fatal car crashes among new drivers. Graduated driver licensing programs and alcohol-impaired driving prevention policies are two examples of such measures, according to the CDC experts.
Graduated driver licensing, or GDL, programs are designed to limit teens’ ability to drive independently until they are older and more comfortable with the conditions of the road. Part of the reasoning behind these programs is that at the age of 16, young drivers have an underdeveloped area of the brain called the dorsal lateral prefrontal cortex, which is critical in making decisions, solving problems and understanding consequences. The prefrontal cortex does not fully develop until the age of 20.
Fatal crash rates are “lower where GDL programs restrict young drivers,” according to the MMWR report.
Thus, there have been different studies to suggest that these programs merely delay crashes until drivers are older and fail to reduce the number of car crashes overall. Even though the programs may reduce the number of fatal crashes among 16- and 17-year-olds, there is a corresponding rise in fatal crashes among those ages 18 and 19.
As the authors of the recent CDC report conceded, their study has some limitations. Death rates were calculated based on data from the National Vital Statistics System, which kept track of where the drivers lived, not where their crashes occurred. Some death statistics were not reported due to liability and confidentiality reasons.
In addition, the authors wrote that more information on other risk factors that are associated with fatal crashes – such as the blood-alcohol concentration of drivers, seat belt use and speed – are needed to solidify the study findings but were deemed unavailable.
You can see how your city stacks up by reading the report online here.
Return to the Booster Shots blog.
[For the record, 1:42 p.m. July 25: An earlier version of this post said that motor vehicle accidents were the leading cause of death in the U.S. in 2009. Car crashes are the leading cause of accidental death but not deaths overall.]
More to Read
Sign up for The Wild
We’ll help you find the best places to hike, bike and run, as well as the perfect silent spots for meditation and yoga.
You may occasionally receive promotional content from the Los Angeles Times.


