Study Finds More Asians Register as Republicans
- Share via
MONTEREY PARK — Asian-Americans here have registered as Republicans at more than twice the rate as Democrats over the past five years, and a substantial number belong to neither party, according to recent statistics compiled by a UCLA professor.
Don T. Nakanishi, an education professor and principal author of a continuing study on Asian voting patterns, said his latest findings show Asians in Monterey Park, the only city in the state with an Asian majority, are becoming more politically involved but are hesitant to commit to a political party.
That indecisiveness, Nakanishi said, means that neither Republicans nor Democrats are making great strides within the Asian community, one of the fastest growing ethnic groups in Los Angeles County.
More than half of Monterey Park’s 62,000 residents, and 39% of its voters, are Asian. Countywide, Asians make up 12.6% of the population, according to 1990 estimates by the county Department of Health Services.
“Asians are slowly creeping up in terms of the electorate,” Nakanishi said, but “the report also suggests neither party is doing much to communicate to new voters. We have found that a lot of voters don’t understand the American concept of political parties.”
Between 1984 and 1989, 2,547 Asians in Monterey Park registered to vote for the first time, including 1,254 Republicans, 489 Democrats and 690 who declined to state a party. The remainder, 114, belonged to other parties.
Meanwhile, the number of non-Asian voters decreased, according to the study. The data for the report used information from November, 1989, voter registration rolls.
There are pronounced differences between Chinese and Japanese voters in the city, largely because the Chinese here are predominantly foreign-born, while the Japanese population is made up largely of second-, third- and fourth-generation residents whose political affiliations are more representative of the city as a whole.
A little more than half of the Japanese voters in Monterey Park are Democrats; a third are Republicans, and 13% are undeclared. The Chinese voting population is 35% Democrat, 37% Republican and 26% undeclared.
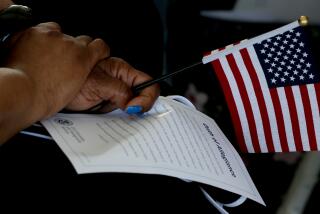
Local Democratic and Republican clubs, recognizing the large influx to Monterey Park of immigrants from Taiwan, China, Hong Kong, Vietnam and Cambodia, have been aggressively recruiting Asian voters in Monterey Park and the West San Gabriel Valley, conducting voter-registration drives around election time and after large swearing-in ceremonies for U.S. citizens.
But Nakanishi suggests these “short-term” outreach efforts aren’t enough.
Many foreign-born Asians come to this country with an inherent distrust of political parties, he said, and registering them to vote is only a preliminary step. With only a rudimentary knowledge of how American government works, many new voters shy away from party membership; others, because of language and cultural barriers, register but don’t vote, he said.
Monterey Park Mayor Judy Chu, an active member of the West San Gabriel Valley Asian Pacific Democratic Club and the Monterey Park Democratic Club, said immigrants may gravitate to the Republican Party because they agree with its stand on foreign policy, primarily its strong anti-communist ideology.
Beyond those factors, Chu said, Asians actually have interests more in line with the Democratic Party, including voting rights, social welfare and affirmative action.
Previous studies also have found a trend within the Asian community toward political conservatism.
In 1986, a Caltech public opinion poll showed Asian-Americans statewide were more politically conservative than blacks or Latinos.
In 1988, an exit poll in Monterey Park by the Asian Pacific American Voter Registration Project and the Southwest Voter Research Institute in San Antonio found that though the Democratic Party was strong among Japanese, Latinos and Anglos, it was weak among Chinese.
The 1986 Caltech survey found that although an influx of non-English-speaking immigrants was dramatically changing the state, Asians were much less supportive of bilingual education than were other minorities, were more likely to favor sanctions against employers who hire illegal immigrants, favored the death penalty more than blacks and Latinos and were more sympathetic than other minorities to defense spending.
“Asians are conservative, real conservative,” said Sherwin Chan, a San Marino businessman and chairman of the Asian American Republican National Assn. “A lot are not active in the party, but Republican-inclined. They don’t like to rally or anything, but if you knock on their doors they will comply with a donation.”
ASIAN VOTERS IN MONTEREY PARK
Number Registered Democrats Republicans Other 1984 Asians 6,441 3,265(51%) 1,944(30%) 54(1%) 1989 Asians 8,988 3,754(42%) 3,198(35%) 168(2%) 1984 Chinese 3,152 1,360(43%) 972(31%) 23(1%) 1989 Chinese 5,356 1,868(35%) 1,989(37%) 100(2%) 1984 Japanese 2,586 1,429(55%) 838(32%) 21(1%) 1989 Japanese 2,919 1,516(52%) 991(34%) 42(1%) 1984 Total voters 22,021 13,657(62%) 5,564(25%) 368(2%) 1989 Total voters 23,184 13,243(57%) 6,684(29%) 369(2%)
No Party 1984 Asians 1,178(18%) 1989 Asians 1,868(21%) 1984 Chinese 797(25%) 1989 Chinese 1,399(26%) 1984 Japanese 298(12%) 1989 Japanese 370(13%) 1984 Total voters 2,290(11%) 1989 Total voters 2,888(12%)
Source: UCLA Education Professor Don T. Nakanishi
More to Read
Sign up for Essential California
The most important California stories and recommendations in your inbox every morning.
You may occasionally receive promotional content from the Los Angeles Times.


