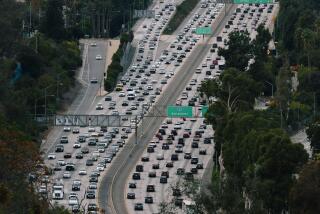
Freeways Inching Toward Gridlock, Caltrans Says : Traffic: Statistics show the number of motorists grew steadily in the ‘80s--from 15% more on a section of the Ventura Freeway to 183% more on the Foothill Freeway.
- Share via
Feeling crowded out there, no matter where you go or when you go? Can’t remember when you could run free on the freeways?
If that’s what the seat of your pants is telling you, there will be no surprises in the latest batch of statistics churned out by Caltrans’ vehicle counters.
Anyone who drives knows that the past decade has been unkind to San Fernando Valley motorists. But the newly compiled California Department of Transportation figures detail just how mean the streets have become.
Throughout the decade, every freeway in the Valley has been strained by an ever larger horde of motorists, the figures show.
Once-bucolic expressways such as the Foothill (210) and Antelope Valley (14) freeways are now carrying heavy loads, and the Ventura Freeway (101), already jammed in 1980, is now bogged down 10 hours out of every 24.
Those highways that a decade ago permitted motorists an occasional unfettered moment are now approaching gridlock.
“No area escaped. Traffic increased everywhere,” said Nick Jones, Caltrans traffic engineer who oversees the traffic counters embedded in concrete at intervals to provide statistical evidence of what motorists already know.
“It’s the same throughout Southern California,” Jones said. “The bad freeways got worse and good freeways, in terms of traffic, started to become bad ones.”
The Caltrans figures, compiled at the request of The Times, give average daily traffic counts on 11 segments of freeways in the Valley and adjacent areas.
Increases ranged from 15% on a section of the Ventura Freeway to an eye-popping 183% on the Foothill Freeway.
In terms of the number of new vehicles per day, differences among freeways were less dramatic, ranging from an increase of 27,000 per day on the Simi Valley Freeway (118) to 57,000 each day on the Antelope Valley Freeway.
The traffic mounted steadily, rather than zooming to new heights in any one year or handful of years.
Each of the 11 freeway segments registered an increase of between 2,000 and 5,000 vehicles every year.
On freeways in the middle part of the Valley--the Hollywood (170), San Diego (405) and Golden State (5)--traffic increased methodically throughout the decade, seemingly oblivious to economic recession, stagnation or boom.
On the other hand, the building explosion of the mid- and late 1980s shows up in much larger annual increases in vehicles on the Simi Valley and Antelope Valley freeways, which handle a heavy share of commuters from the fast-growing suburbs in the Santa Clarita Valley and Ventura County.
The Ventura Freeway, long the Valley’s main east-west artery, seems to have taken a different route to its current condition.
Along its 35-mile length from Glendale to Westlake Village, the Ventura, which early in the decade was already one of the nation’s three or four busiest freeways, added about 40,000 motorists per day during the 1980s. But even that hefty number was substantially less than the 57,000 additional vehicles that began squeezing onto the Antelope Valley Freeway during the 1980s.
The Ventura is “virtually gridlocked,” Stanley Hart, transportation spokesman for the Sierra Club, said. “So, even though it’s a freeway that people would like to use because of its location, they have begun to employ other strategies to get to work.”
Hart and other traffic analysts say that when confronted with a heavily crowded freeway, motorists initially attempt to avoid the crowds by driving earlier or later--hence the longer rush hours on the Ventura.
“Once that no longer works,” Hart said, “they next will try alternative routes, including surface streets.”
Finally, he said, commuters “as a last resort, will move closer to their work or change jobs so they don’t have to use a seriously gridlocked freeway.”
He speculates that the crowded conditions on the Ventura, the San Diego Freeway through the Westside and South Bay and several Orange County freeways have begun to deter people from taking jobs that require using a freeway.
“People will not accept absolute gridlock,” Hart said. “At some point, they will take action, even if it’s painful.”
With ever more cars using them, the three Valley north-south freeways seem to face a future much like the Ventura’s present malaise.
“Those used to be pretty easy-to-use freeways,” Jones said. “But they’re getting close to capacity. Their future is not rosy.”
If the Ventura represents the Valley’s future, the Foothill suggests its past.
Completed in the late 1970s, the freeway from Sylmar to Pasadena initially was welcomed as a traffic-free route to bypass downtown Los Angeles.
But instead it has increasingly served large numbers of residents of new developments in Sylmar, the fastest-growing community in Los Angeles, and in the Santa Clarita and Antelope valleys.
Though not yet gridlocked, traffic more than tripled in the 1980s, and serious congestion seems likely in a few years, engineers say.
“I think that freeway has had a symbiotic relationship with the Santa Clarita Valley,” Hart said. “It’s grown right with that valley.”
To Jones, the Foothill is graphic evidence that “wherever we build a freeway, development seems to follow. No freeway stays uncrowded for long.”
TRAFFIC ON VALLEY FREEWAYS Vehicles per day 101 FWY. Hollywood Fwy. to San Diego Fwy. 1980 222,000 1989 258,000 +16% San Diego Fwy. to Topanga Canyon Blvd. 1980 215,000 1989 247,000 +15% Topanga Canyon Blvd. to Ventura County line 1980 112,000 1989 153,000 +37% 134 FWY. Hollywood Fwy. to Glendale Fwy. 1980 135,000 1989 187,000 +39% 405 FWY. Ventura Fwy. to Golden State Fwy. 1980 127,000 1989 178,000 +40% 5 FWY. Ventura Fwy. to Hollywood Fwy. 1980 123,000 1989 169,000 +37% Foothill Fwy. to Route 126 1980 56,000 1989 117,000 +92% 170 FWY. Ventura Fwy. to Golden State Fwy. 1980 97,000 1989 134,000 +38% 118 FWY. San Diego Fwy. to Ventura County line 1980 91,000 1989 118,000 +30% 14 FWY. Golden State Fwy. to Sand Canyon Rd. 1980 38,000 1989 95,000 +150% 210 FWY. Simi Fwy. to Glendale Fwy. 1980 30,000 1989 85,000 +183% *118 freeway completed in 1983 Source: CalTrans
More to Read
Sign up for Essential California
The most important California stories and recommendations in your inbox every morning.
You may occasionally receive promotional content from the Los Angeles Times.


