Voter Turnout May Be Lowest in 52 Years
- Share via
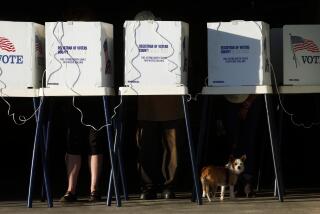
SACRAMENTO — As election results slowly trickled in late Tuesday, California appeared headed for the worst voter turnout for a presidential primary since Franklin D. Roosevelt ran for a third term 52 years ago, California Secretary of State March Fong Eu said.
She attributed the poor turnout to the seeming irrelevance of the California vote in the nomination of presidential candidates in both major parties.
“The primary election here in California is so late that it’s already decided by the rest of the country who the Democratic and Republican nominees will be,” she said.
Eu also noted that there were only three statewide propositions on the ballot and that none was placed there by initiative. Ballot measures that qualify by initiative petition often are controversial and attract considerable voter attention.
Eu estimated that the turnout was about 44% of California’s 13.6 million registered voters. The only time the turnout for a presidential primary was lower was in 1940, when it was 43%. In those days, a separate presidential primary was held in May, three months before the primary for state and local offices.
Complicating the vote count this year was the large number of write-in ballots cast for undeclared independent presidential candidate Ross Perot.
Each ballot with a Perot write-in had to be set aside to determine whether the voter also had punched a vote for a regular party candidate for President. If so, the presidential vote on that ballot will not count. The rest of the ballot will be counted, but probably not for some time, perhaps several days.
Perot’s write-in votes will not be counted because he was not an official write-in candidate, election officials said. Perot’s supporters are working to qualify him for the November ballot.
Voter Turnout
Here is a list of state voter turnout percentages for presidential and gubernatorial primary and general elections.
YEAR ELECTION TURNOUT CANDIDATES June 1992 Presidential primary 44%* Nov. 1990 Gubernatorial general 58.61% Wilson-Feinstein June 1990 Gubernatorial primary 41.49% Nov. 1988 Presidential general 72.81% Bush-Dukakis June 1988 Presidential primary 46.06% Nov. 1986 Gubernatorial general 59.99% Deukmejian-Bradley June 1986 Gubernatorial primary 38.61% Nov. 1984 Presidential general 73.87% Reagan-Mondale June 1984 Presidential primary 49.30% Nov. 1982 Gubernatorial general 69.72% Deukmejian-Bradley June 1982 Gubernatorial primary 52.95% Nov. 1980 Presidential general 76.55% Reagan-Carter June 1980 Presidential primary 64.17% Nov. 1978 Gubernatorial general 68.67% Brown-Younger June 1978 Gubernatorial primary 74.09% Nov. 1976 Presidential general 81.08% Carter-Ford June 1976 Presidential primary 71.24% Nov. 1974 Gubernatorial general 62.60% Brown-Flournoy June 1974 Gubernatorial primary 51.69% Nov. 1972 Presidential general 80.43% Nixon-McGovern June 1972 Presidential primary 68.93% Nov. 1970 Gubernatorial general 75.52% Reagan-Unruh June 1970 Gubernatorial primary 61.32% Nov. 1968 Presidential general 86.24% Nixon-Humphrey June 1968 Presidential primary 71.34% Nov. 1966 Gubernatorial general 79.55% Reagan-Brown June 1966 Gubernatorial primary 64.13% Nov. 1964 Presidential general 88.91% Johnson-Goldwater June 1964 Presidential primary 70.86%
* Estimated turnout
Source: L.A. County registrar-recorder
Compiled by researcher Cecilia Rasmussen
More to Read
Get the L.A. Times Politics newsletter
Deeply reported insights into legislation, politics and policy from Sacramento, Washington and beyond. In your inbox twice per week.
You may occasionally receive promotional content from the Los Angeles Times.


