Two Indicators Clash Over 1999’s Prospects
- Share via
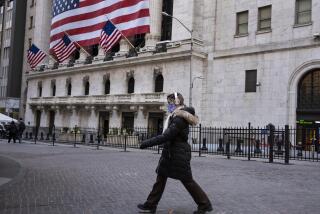
The battle of the market indicators is set: The “January barometer” says it’s going to be a good year for stocks, while the “Super Bowl indicator” says the bear looms on Wall Street.
Both of these market fortunetelling tools have had great records, historically. So maybe it’s fitting that in a market environment as baffling as this one has been for many professionals, two of Wall Street’s favorite prognosticators should add more confusion to the mix.
Here’s how the two indicators are supposed to work:
* The January barometer says that as January goes for stocks, so goes the year. If the blue-chip Standard & Poor’s 500 index rises in January, it’s a very good bet that the index will end the year with a gain as well.
This January, the S&P; rose 4.1% (not counting dividends). So score one for the bulls.
Since 1950, the January barometer has worked 82% of the time, according to the Stock Trader’s Almanac, an annual publication by veteran market analyst Yale Hirsch in Old Tappan, N.J.
Last year, the S&P; rose 1% in January. And despite a near-20% plunge in the index in late summer, it still ended the year with a 26.7% gain.
* The Super Bowl indicator says that the market should rise in a year when the National Football Conference team wins the game and that stocks should fall in a year when the American Football Conference team wins.
The indicator also stacks the deck a bit in favor of the bulls, however, by counting as NFC teams the three AFC teams that were part of the old National Football League before it merged with the American Football League in 1970.
In any case, the indicator had a 90% accuracy rate (back to the first Super Bowl, 33 years ago) going into last year--when it failed, as the AFC Denver Broncos’ victory was followed by another full-year gain in the S&P; index and most other major stock indexes.
The Broncos, of course, won again on Sunday, which means the Super Bowl indicator is again predicting a down year for stocks.
How could the outcome of a football game predict the trend on Wall Street? Obviously, there’s no direct connection, experts say.
“The Super Bowl theory is what you call the result of ‘data mining,’ ” explained Sam Stovall, chief investment strategist for Standard & Poor’s Industry Reports. “That means you find something that has no influence on the market but has a high correlation to the market.”
The January barometer, by contrast, makes some sense--if you assume that a January market gain indicates that investors are optimistic for the year.
And the flip side also makes sense--that pessimism in January could infect the entire year. Indeed, the bear market years of 1973, 1974, 1981 and 1990 all were foretold by the January barometer.
Still, the barometer was wrong as recently as 1994, when the S&P; index rose 3.3% in January yet finished the year down 1.5%.
As for the Super Bowl indicator, die-hard Wall Street bears argue that the indicator was accurate last year: There was a bear market in most stocks, by late summer. And indeed, most stocks declined in price for the full year, despite the gains in key indexes such as the S&P.;
More to Read
Inside the business of entertainment
The Wide Shot brings you news, analysis and insights on everything from streaming wars to production — and what it all means for the future.
You may occasionally receive promotional content from the Los Angeles Times.


