THE TIMES POLL : Feinstein Holds 11-Point Margin Over Van de Kamp
- Share via
Propelled by women and strengthened by her advocacy of the death penalty and abortion rights, Dianne Feinstein is running 11 points ahead of John K. Van de Kamp nearing the finish of their race for the Democratic gubernatorial nomination, according to The Los Angeles Times Poll.
One other key factor--a dynamic personality, contrasted with the cool, lawyer-like demeanor of her opponent--has helped Feinstein maintain and solidify her lead in the last three months.
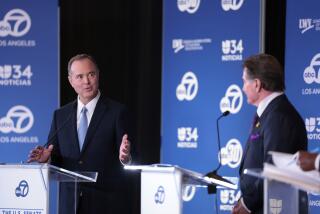
The two recent televised debates--the premier public events of this long election campaign--did not help Van de Kamp, the Times survey indicated.
Democratic voters were split about evenly over who they thought won the final debate last Sunday. Before the encounter, 35% told Times interviewers they expected to watch it. But afterward, only 6% said they had. Van de Kamp came across as the “more knowledgeable,” voters told The Times. But Feinstein was the “most likeable” and “displayed the strongest personality and character.”
The Times survey, which ended Wednesday night, found Feinstein leading Atty. Gen. Van de Kamp by 38% to 27% with a large 35% still undecided.
Neither candidate, according to the last four Times polls, has picked up any significant support since late February when Feinstein vaulted ahead with a strategically timed television commercial that emphasized her advocacy of abortion rights and the death penalty and her leadership as mayor of San Francisco after succeeding the assassinated George Moscone. Nor has the number of undecided voters been reduced since then.
The undecided--compared to the rest of the Democratic electorate--tend to be more apolitical and less liberal; more blue collar and less educated. But more importantly, they also tend to be female. Three-quarters of the undecided are women, including two-thirds of those most likely to vote.
This means that the numbers clearly favor Feinstein in her drive to become California’s first woman gubernatorial nominee of a major party. Women who already have chosen up sides support her by 5 to 3. So if the undecided women break the same way as those already committed, they will boost Feinstein’s lead substantially.
But if Feinstein does emerge as the Democratic nominee on June 5 and battles Republican U.S. Sen. Pete Wilson in November, she may find the gender equation significantly altered as GOP voters are tossed into the electoral mix.
In a hypothetical November runoff, Wilson holds a slight lead over Feinstein, 42% to 36% with 21% undecided and 1% for “someone else,” according to the Times survey. Women divide about evenly between Feinstein and Wilson, while men support the senator by 4 to 3.
In a Van de Kamp-Wilson matchup, Wilson leads by roughly the same margin: 44% to 36% with 20% undecided.
The Times poll, directed by I.A. Lewis, interviewed 1,730 registered voters by telephone for seven days beginning May 17. Among these were 854 Democrats, 621 Republicans, 218 independents and 37 members of minor parties. The margin of error for all the registered voters is three percentage points in either direction. For the Democrats and Republicans separately, the error margin is five points.
The poll also measured voter opinions about other contests on the state primary ballot, including these:
Democratic attorney general: San Francisco Dist. Atty. Arlo Smith has pulled even with Los Angeles County Dist. Atty. Ira Reiner after trailing for months. But, as with other state contests below governor, there is a whopping number of undecided voters. The latest result shows Smith 21%, Reiner 20%, undecided 59%. Los Angeles County supports Reiner by nearly 2 to 1, but the San Francisco Bay Area backs Smith by 4 to 1. Smith leads 3 to 1 in the remainder of Northern California and the candidates are running even in the rest of Southern California.
Republican treasurer: Incumbent Thomas W. Hayes has retaken the lead over Angela (Bay) Buchanan, 25% to 14% with 61% undecided. In the previous Times survey, the two were tied. The difference in results of the two polls, at least partially, may be in how Buchanan was identified. In the earlier poll, she was identified as a former U.S. treasurer. In the latest survey, she was characterized exactly as she will appear on the ballot: “Chief Financial Officer.”
Republican lieutenant governor: This contest still is a mystery to the electorate. State Sen. John Seymour (R-Anaheim) had 17%, State Sen. Marian Bergeson (R-Newport Beach) had 13% but 70% were undecided.
Proposition 111: Voters are divided about evenly on this controversial measure, which would raise the gasoline tax and alter the state spending limit in order to finance a 10-year transportation plan. The poll showed 45% in favor, 42% opposed, and 13% undecided. Democrats are more inclined to support the measure than Republicans, but voters of each party are basically split.
Proposition 108: A companion to Proposition 111, this $1-billion bond issue for light rail is supported overwhelmingly, 59% to 27%, with 14% undecided.
Proposition 116: Voters are divided on this separate $1.9-billion bond issue for rail systems, with 41% in favor, 42% opposed, and 17% undecided.
Ever since February, three or four factors have dominated the Democratic gubernatorial race and they continue to do so as election day approaches.
First and foremost is Feinstein’s natural appeal to women, enhanced by the lure of her becoming the first woman governor in California’s history. Second is her adamant positions on two issues that California voters care deeply about: the death penalty and abortion rights. Third is her personality. And beyond that, she benefits from some stereotypes long associated with women--they’re caring, honest and concerned about schools.
Feinstein’s supporters actually have an agenda that is a little different than Van de Kamp’s, the Times survey found. The attorney general’s supporters--like voters as a whole--say that “issues involving crime and drugs” are “usually the most important” when they decide whom to back for governor. But among Feinstein’s supporters, education is just as important as fighting crime.
Education ranks second on the list of priorities for Van de Kamp supporters, as it does for voters as a whole. Abortion is a close third on the issues list of Van de Kamp and Feinstein supporters alike, but women are a lot more concerned about it than are men.
By 3 to 1, Democratic voters believe that Feinstein “would do the best job as far as abortion is concerned.”
Four in 10 Democrats who generally favor abortion say they probably would switch to another candidate if they believed the person they had been planning to vote for was “much less strongly committed to abortion rights” than the other contender. This is especially true of Feinstein’s supporters. And it means that Feinstein may have been playing with political fire when she told reporters after the first gubernatorial debate that she “might well” sign legislation banning abortion for sex selection.
Feinstein quickly backed off that notion the next day and again pledged her unequivocal support for a woman’s right to choose for herself whether to have an abortion for any reason. Previously, Van de Kamp was thought to be the vulnerable candidate on this issue because although he publicly supports a woman’s right to choose, he personally opposes abortion.
By 7 to 1, Democratic voters support a woman’s right to choose for herself and reject the idea that “the government has a legitimate right to regulate abortion.” Feinstein’s voters feel this way by 13 to 1. But there is a seeming contradiction here. When asked whether “it should be legal for a woman to have an abortion because she prefers a child of the opposite sex,” Democratic voters answered “no” by 4 to 1.
Times pollster Lewis said: “People generally think about abortion situationally, not theoretically. Every situation is considered one at a time on its own merits, without worrying about whether it is consistent with any other abortion attitude. In that sense, Californians see no contradiction between opposing the widely condemned idea of government regulation of abortion and yet at the same time favoring laws to stop the widely condemned idea of gender selection by abortion.”
As for fighting crime, voters rate the attorney general only slightly better than Feinstein. And by 7 to 3, they regard her as best at handling the death penalty.
Roughly one-fourth of the Democrats who favor the death penalty say they probably would switch their allegiance to another candidate if they believed the person they had been supporting was “much less strongly committed” to capital punishment than the other contender. This would seem to work to the advantage of Feinstein, since she is unswervingly for capital punishment and is constantly questioning Van de Kamp’s commitment to carry out executions because he personally opposes the death penalty.
Feinstein’s voters told Times interviewers that the “single most important quality” that attracts them to her is the belief that she “can get things done.” Van de Kamp’s chief attraction for his supporters is his “experience.”
By 3 to 2, Democrats think Feinstein possesses “the strongest qualities of leadership.” By 2 to 1, they believe she is the candidate who “cares most” about people like themselves. And by 5 to 2, she is considered “the most dynamic.”
Feinstein may have come close to alienating some Democratic voters in the first debate by saying she would put “everything on the table” during state budget negotiations, including cost of living adjustments (COLAS) for the aged, blind and disabled. She later backed off, pledging to protect these benefit increases in negotiations. Three-fourths of the Democratic voters in this survey--and 82% of Feinstein’s supporters--opposed freezing cost-of-living increases for the needy.
Regionally, Feinstein leads by 7 to 4 in Los Angeles County, despite it being Van de Kamp’s home turf. The candidates are running even in the rest of Southern California. Feinstein leads 3 to 2 in the Bay Area and 5 to 3 in the remainder of Northern California.
It does not appear that the size of the voter turnout on election day will have a major impact on the result, according to the latest Times survey. Feinstein’s lead is roughly the same regardless of whether the turnout is projected to be large--say, in the 58% range--or historically low, down around 37%.
Feinstein’s support is more solid than Van de Kamp’s, the poll indicated. Compared to the front-runner, there are significantly more voters in Van de Kamp’s column who are merely “leaning” his way, as opposed to being fairly certain of their vote. Looked at from another angle, nearly half of Feinstein’s voters say they support her “very strongly.” But only slightly more than a third of Van de Kamp’s voters feel “very strongly” about him.
About one in six voters say they probably will vote absentee rather than actually go to the polls on June 5. Feinstein’s lead is slightly larger among these likely absentee voters.
VOTER PREFERENCES
Chart shows changes over the months in the race between Dianne Feinstein and John K. Van de Kamp for the Democratic nomination for governor, as found by The Times Poll. If the Democratic primary were being held today, who would you vote for? FEINSTEIN Oct. 1989: 25% Dec. 1989: 25% Early Mar. 1990: 43% Late Mar. 1990: 35% Early May 1990: 37% Late May 1990: 38% VAN DE KAMP Oct. 1989: 37% Dec. 1989: 35% Early Mar. 1990: 24% Late Mar. 1990: 24% Early May 1990: 24% Late May 1990: 27%
Tables below show changes over the months in other major statewide races. The latest Times survey results appear in column one.
If the Democratic primary were being held today, who would you vote for? Attorney General
RACE 5/23/90 5/3/90 3/28/90 3/1/90 12/89 10/89 Ira Reiner 20% 24% 19% 18% 22% 28% Arlo Smith 21% 16% 13% 12% 12% 14% Someone else -- 1% 1% 2% 1% 2% No opinion 59% 59% 67% 68% 65% 56%
Insurance Commissioner
RACE 5/23/90 5/3/90 3/28/90 3/1/90 12/89 10/89 Michael Blanco 1% 2% NA NA NA NA Ray Bourhis 1% 1% 1% NA NA NA Conway Collis 2% 1% 2% NA NA NA John Garamendi 10% 10% 9% NA NA NA Larry Murphy 2% NA NA NA NA NA Bill Press 11% 8% 11% NA NA NA Walter Zelman 4% 6% 5% NA NA NA Someone else -- 1% -- NA NA NA No opinion 69% 71% 72% NA NA NA
NOTE: Based on registered Democrats.
If the Republican primary were being held today, who would you vote for? Lt. Governor
RACE 5/23/90 5/3/90 3/28/90 3/1/90 12/89 10/89 Marian Bergeson 13% 7% 4% 8% 6% 4% John Seymour 17% 10% 6% 5% 7% 6% Someone else -- 1% 1% 1% -- -- No opinion 70% 82% 89% 86% 87% 90%
Insurance Commissioner
RACE 5/23/90 5/3/90 3/28/90 3/1/90 12/89 10/89 Wes Bannister 13% 9% 8% NA NA NA Tom Skornia 10% 7% 5% NA NA NA Someone else 2% 1% 1% NA NA NA No opinion 75% 83% 86% NA NA NA
Treasurer
RACE 5/23/90 5/3/90 3/28/90 3/1/90 12/89 10/89 Angela Buchanan 14% 18% 15% 12% 15% 9% Thomas W. Hayes 25% 18% 21% 24% 17% 20% Someone else -- 1% 1% 1% 1% 1% No opinion 61% 63% 63% 63% 67% 70%
NOTE: Based on registered Republicans.
KEY PROPOSITIONS
If the primary were being held today, how would you vote on each proposition? 108: Rail Bonds
PROPOSITION 5/23/90 5/3/90 3/28/90 3/1/90 12/89 10/89 Favor 59% 63% 64% NA NA NA Oppose 27% 23% 21% NA NA NA Don’t know 14% 14% 15% NA NA NA
111: Gas Tax
PROPOSITION 5/23/90 5/3/90 3/28/90 3/1/90 12/89 10/89 Favor 45% 47% 45% NA NA NA Oppose 42% 40% 42% NA NA NA Don’t know 13% 13% 13% NA NA NA
116: Rail Bonds
PROPOSITION 5/23/90 5/3/90 3/28/90 3/1/90 12/89 10/89 Favor 41% 42% 44% NA NA NA Oppose 42% 39% 38% NA NA NA Don’t know 17% 19% 18% NA NA NA
112: Govt. Ethics
PROPOSITION 5/23/90 5/3/90 3/28/90 3/1/90 12/89 10/89 Favor 44% 45% NA NA NA NA Oppose 39% 39% NA NA NA NA Don’t know 17% 16% NA NA NA NA
115: Criminal Law
PROPOSITION 5/23/90 5/3/90 3/28/90 3/1/90 12/89 10/89 Favor 66% 65% 65% NA NA NA Oppose 19% 18% 17% NA NA NA Don’t know 15% 17% 18% NA NA NA
118: Reapportionment
PROPOSITION 5/23/90 5/3/90 3/28/90 3/1/90 12/89 10/89 Favor 42% 43% NA NA NA NA Oppose 32% 27% NA NA NA NA Don’t know 26% 28% NA NA NA NA
119: Reapportionment
PROPOSITION 5/23/90 5/3/90 3/28/90 3/1/90 12/89 10/89 Favor 37% 41% NA NA NA NA Oppose 37% 31% NA NA NA NA Don’t know 26% 28% NA NA NA NA
NOTE: Based on registered voters.
More to Read
Get the L.A. Times Politics newsletter
Deeply reported insights into legislation, politics and policy from Sacramento, Washington and beyond. In your inbox twice per week.
You may occasionally receive promotional content from the Los Angeles Times.


