Higher Speed Limit Still Worries Safety Advocates--but Key Accident Rates Are Down
- Share via
In countless speeches and lobbying campaigns, proponents of the “national maximum” of 55 mph cited government figures showing that if states were free to set higher limits without the threat of losing federal highway funds, the results would be shocking: 6,400 additional deaths each year--or a 15% increase--at a cost of $20 billion to U.S. taxpayers and the insurance industry.
That kind of a spike in fatalities would have qualified 1996 as one of the most horrific years in the history of the motor vehicle, particularly in California, home to 13% of all the cars in the nation.
National statistics won’t be available until later this year, but it didn’t turn out that way in California in 1996, the first full year without a national 55-mph limit.
According to the California Highway Patrol, although the total number of accidents went up 1.7% last year, fatal crashes--the main focus of 55-mph advocates--actually fell 4.6%. Speeding tickets handed out by the CHP also fell during the same period, by 17%.
“If you look at injury accidents, they were down,” said CHP spokesman Steve Kohler. “Less severe crashes increased. It could be in part due to technology--for example, in a crash where someone could have been injured, safety belts, air bags or vehicle design all combined to prevent those injuries.”
Kohler added that in 1995, the mileage death rate--the number of victims killed per 100 million miles of vehicle travel--was the lowest in California history at 1.51. The final results for 1996 are still being compiled, he said, but the preliminary indications are that the rate will be even lower.
“Theoretically, higher speed limits should result in more crashes and more fatalities if every other factor held constant,” said Joe Cindrich, a regional director for the National Highway Transportation Safety Administration in San Francisco. “But we really don’t have any evidence that raising the speed limit is causing more accidents in California.”
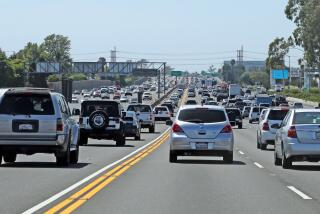
It appears that the higher speed limit does not promote faster driving.
A recent Caltrans study compared average vehicle speeds in a dozen locations before and after the new speed limit took effect. The study found that average speed increased less than 1 mph on the freeways surveyed, said Caltrans spokesman John Robin Witt.
“You’ve heard of the term voting with your feet,” Witt said. “California motorists were already voting with their accelerators.
“Most seem to believe that traveling at higher speeds is safe and prudent. Put another way, when the speed limit was 65, motorists were traveling near 70 mph. The change merely made those speeds legitimate.”
Safety advocates and the insurance industry disagree.
The national speed limit was established in 1974 to curtail gasoline consumption during the Middle East oil embargo.
But one of the ancillary effects was safety. The year after the legislation passed, there were 9,000 fewer highway fatalities, the greatest single one-year decrease since World War II.
Proponents of “55 Saves Lives” also cite a 1988 National Highway Traffic Safety Administration study conducted in 18 states--including California--the year after Congress voted to increase the speed limit to 65 mph on rural roads.
It found that although there were marginal increases in average speed after the change, three times as many vehicles were traveling faster than 70 mph and 11 times as many were topping 80 mph.
Dennis Unsworth, chief of the Montana Transportation Department, is noticing the difference in speed with the latest change.
Montana raised eyebrows when it immediately reverted to the “reasonable and prudent” speed standard--no fixed numerical limit--for daytime driving on rural highways that was in effect before the federal government imposed the state’s first daytime speed limit. But many took it as a sign that the roads in the Big Sky state had turned into “Montanabahns.”
Although fatalities fell 8% on Montana roads last year, Unsworth said it’s not fair to say that the lack of fixed speed limits is nothing to worry about.
“There are more variations in speed and the mix of slow- and fast-moving traffic. It’s something the safety people are concerned about,” he said.
*
But although there has been agitation to enact a daytime speed limit, the Montana Legislature adjourned this year without doing so and won’t meet again until 1999.
Advocates for lower speed limits concede that they are waging an uphill struggle.
“It’s a battle that has been lost,” said Kathy Hickey of Washington, D.C.-based Advocates for Highway and Auto Safety.
James J. Baxter, president of the National Motorists Assn., an organization that led the fight to repeal the national speed limit, is pleased with the results so far, especially considering the alternative.
“You can be guaranteed if the fatalities went up as a result of the increased speeds that it would have been plastered all over every daily, weekly and monthly in the U.S.,” he said. “Our predictions were that there would be no significant change in fatalities one way or another. Obviously, 38 states felt the same way when they raised their speed limits.”
(BEGIN TEXT OF INFOBOX / INFOGRAPHIC)
State Impact
Here is a look at how higher speed limits have affected state highways:
*
Average Speed on Roads Where Speed Limit Changed From 55 to 65:
1995: 68.3 mph
1996: 68.6 mph
*
Average Speed on Roads Where Speed Limit Changed From 65 to 70:
1995: 71.6 mph
1996: 72.1 mph
*
Fatal Accidents
1,796 fewer in 1996 than 1995, a drop of 4.6%
*
Speeding Citations Given by CHP Officers:
1995: 992,626
1996: 819,910
Sources: Caltrans; California Highway Patrol


