Where are California’s dirtiest beaches? This list might surprise you
- Share via
After a catastrophic year of oil spills and sewage equipment failures, here’s some good news for the California coast: Most beaches across the state are still much cleaner than in decades past.
In its annual “report card,” Heal the Bay graded more than 700 beaches and found that 94% of California’s beaches logged clean water-quality marks between April and October 2021, and that 51 beaches had perfect year-round scores — a good sign for a shoreline once riddled with so much trash and bacteria that people often got sick when they swam.
But the report still found troubling pockets of pollution — some surprising and others stubborn — especially in the winter months.
Another year of extreme drought has also made things more complicated: Beaches tend to be less polluted in drier years (imagine all the litter, pesticides and microplastics that flush into the ocean whenever it rains), but this trend has become less clear-cut. Scientists are starting to study how record wildfires and changing storm patterns could also affect water quality by the shore.
Without further ado, here are the dirtiest beaches in California:
1. Erckenbrack Park (Foster City, San Mateo County)
2. Marlin Park (Foster City, San Mateo County)
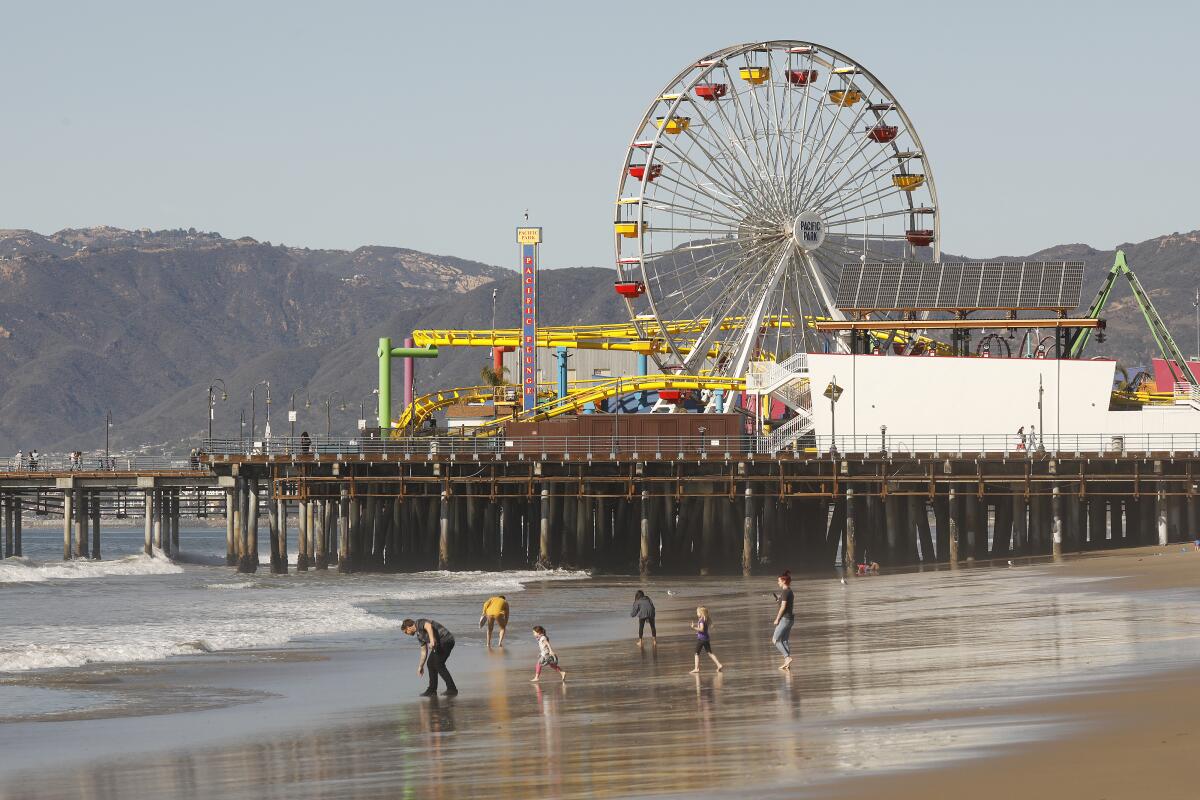
3. Santa Monica Pier (Santa Monica, Los Angeles County)
4. Mother’s Beach (Marina del Rey, Los Angeles County)
5. Moonstone County Park (Humboldt County)
6. Newport Bay, Vaughn’s Launch (Orange County)
7. Lakeshore Park (San Mateo County)
8. Tijuana Slough, north of Tijuana River mouth (San Diego County)
This annual report card, now in its 32nd year, is based on routine water-quality testing conducted by local health officials, sanitation departments and state and tribal agencies. Beach samples are analyzed for three fecal-indicator bacteria that show pollution from numerous sources, including human and animal waste.
Because each agency formats their raw data in different (and sometimes confusing) ways, Heal the Bay — an environmental nonprofit based in Santa Monica — began compiling and translating the information into simple A-plus through F grades for the public. Swimming at a beach with a grade of C or lower greatly increases the risk of skin rashes, ear and upper respiratory infections, and other illnesses such as the stomach flu.
The State Water Resources Control Board endorses this report, which helps scientists and policymakers spot trends and specific beaches that need closer attention.
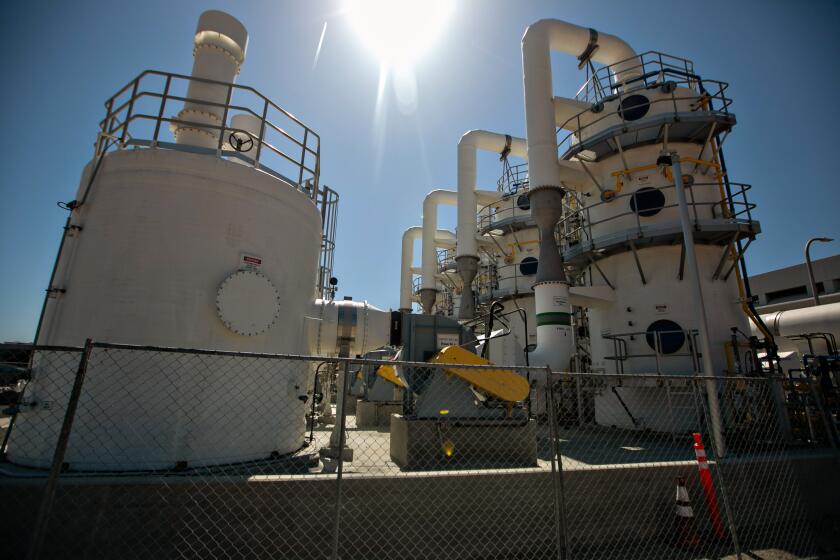
Santa Monica Pier, for example, came as a surprise this year. This popular tourist attraction used to consistently log the worst grades in the state because of a big storm drain under the pier. But that changed after 2018, when the city built a 1.6-million-gallon tank beneath the parking lot to capture and recycle dirty runoff before it flushed into the ocean.
City officials are still trying to figure out what’s causing this new spike in pollution. Birds roosting and pooping under the pier are likely culprits. (Birds are also likely behind the high bacteria concentrations logged this year at Vaughn’s Launch in Newport Bay, which is situated within an ecological reserve.)
Beaches with poor circulation also continue to be an issue. For the third year in a row, a concerning number of beaches in San Mateo County topped the list of dirtiest beaches in California. Many of these swimming areas — similar to Mother’s Beach in Marina del Rey — are confined by urbanized channels and harbors.
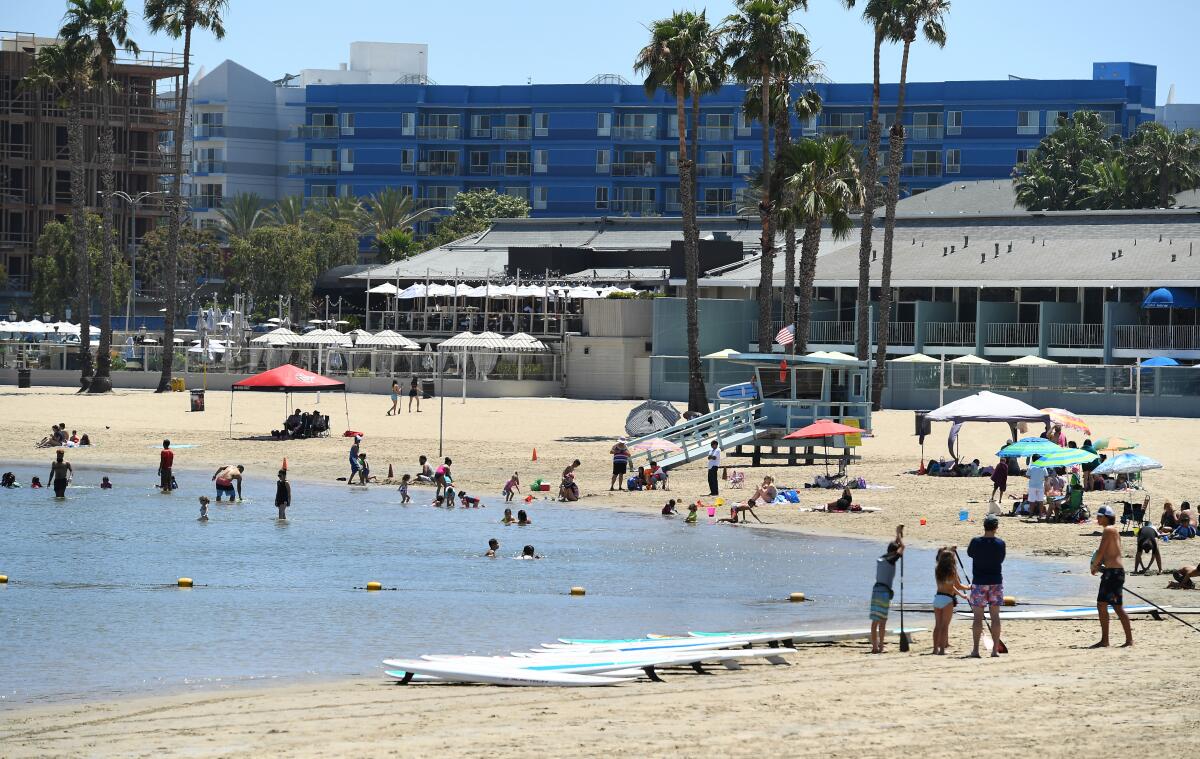
Although these beaches are shielded from big waves — making them popular for families with young children — pollution and bacteria build up easily with so little circulation.
“The physical nature of those beaches is a big issue — the surrounding development goes right up to the water’s edge,” said Luke Ginger, a water quality scientist at Heal the Bay. “So there’s a lot of concrete, a lot of impervious surfaces. The stormwater flows right off the street and into the water.”
Failing infrastructure also proved to be a huge problem this past year. Last summer, 17 million gallons of sewage spewed into the waters off Dockweiler and El Segundo beaches after equipment at Los Angeles’s largest wastewater treatment facility broke down. Off the coast of Huntington Beach, an estimated 25,000 gallons of oil leaked into the sea in October after an aging pipeline ruptured.
A study finds ‘little or no evidence’ that illegally dumped debris caused the July spill in Santa Monica Bay — as sanitation officials initially said.
At the border with Mexico, almost a billion gallons of sewage flushed into the Pacific after a deteriorating pipe known as the “International Collector” cracked in January. Communities near the mouth of the Tijuana River — which starts in Mexico but enters the ocean in California — have been chronically haunted by these failures to contain raw sewage flows.
“Just one big failure can undo a lot of work and cause a lot of problems,” said Ginger, who noted the many decades of efforts to clean up California’s beaches. “With aging and deteriorating infrastructure, we’re worried that events like this will become more common.”
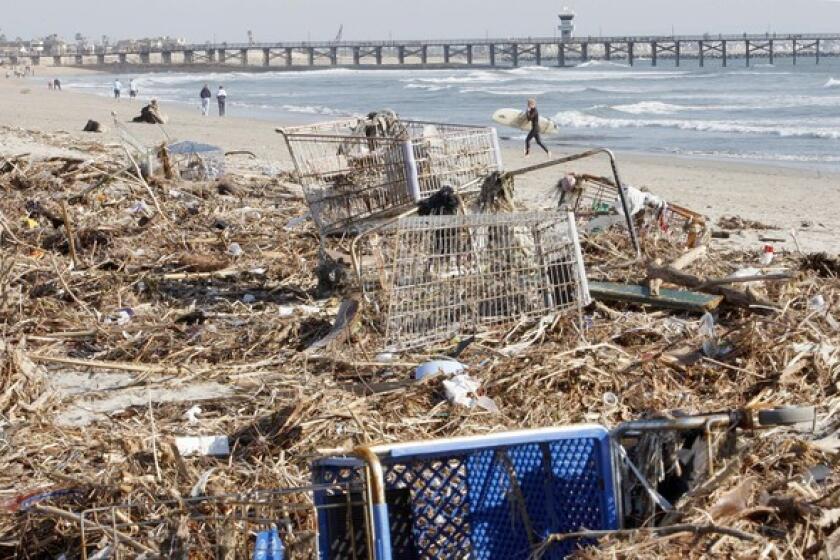
Massive spills aside, runoff from storm drains remains the largest source of pollution for California’s beaches. Unlike sewage, which is usually filtered through treatment facilities before it’s released, most of this dirty water flushes straight into the ocean through a network of storm drains and concrete-lined rivers.
After another back-to-back cold front that pelted rain, heavy snow and even a tornado warning down onto Southern California, here are some precautions and commonly asked questions about whether it’s safe to go to the beach.
A good rule of thumb is to stay at least 100 yards away from storm drains and piers — and to be mindful when swimming in enclosed beaches. And always, always wait at least 72 hours after it rains before going into the ocean.
Ginger and his team have also been improving their daily reports, dubbed NowCast, at 25 local beaches to help people stay better informed. And for the second time this year, the report card included three popular beaches in Tijuana that are regularly affected by raw sewage: El Faro, El Vigia and Playa Blanca, which received the worst grade out of all the beaches assessed this year.
Inspired by the way this annual beach report has led to better statewide standards, a growing movement of people are now directing their attention up the watershed — to the many rivers and creeks that feed into the ocean and serve as recreation for inland communities.
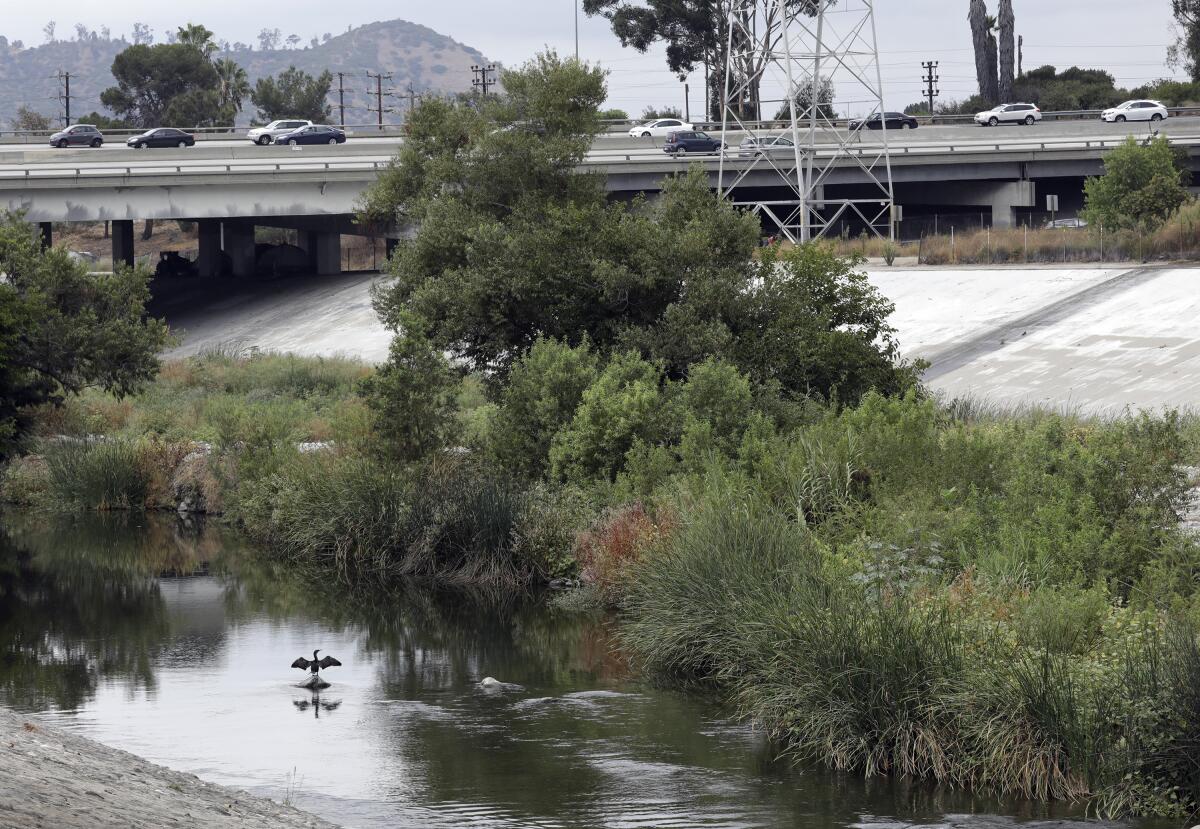
The same urban runoff polluting the ocean often starts in these seemingly fresh rivers. But unlike today’s beach monitoring, there is no statewide oversight or standardization for freshwater pollution monitoring in California. Because of this data gap, people swimming in rivers are not provided the same public health information as beachgoers.
Now in its fourth year, Heal the Bay’s “river report card” uses a similar grading framework for 35 sites along Malibu Creek, the Los Angeles River and San Gabriel River in Los Angeles County.
Here are popular river locations in the Los Angeles area that pose the highest risk of illness:
1. Los Angeles River at Riverfront Park (Maywood)
2. Los Angeles River below the Rio Hondo Confluence (South Gate)
3. Los Angeles River at Hollydale Park (South Gate)
4. Compton Creek
5. Los Angeles River below the Compton Creek Confluence (Long Beach)
6. Tujunga Wash at Hansen Dam (Pacoima)
7. Los Angeles River at Willow Street (Long Beach)
8. Los Angeles River at Rattlesnake Park (Elysian Valley)
9. Las Virgenes Creek (Malibu Creek State Park)
10. Bull Creek (San Fernando Valley)
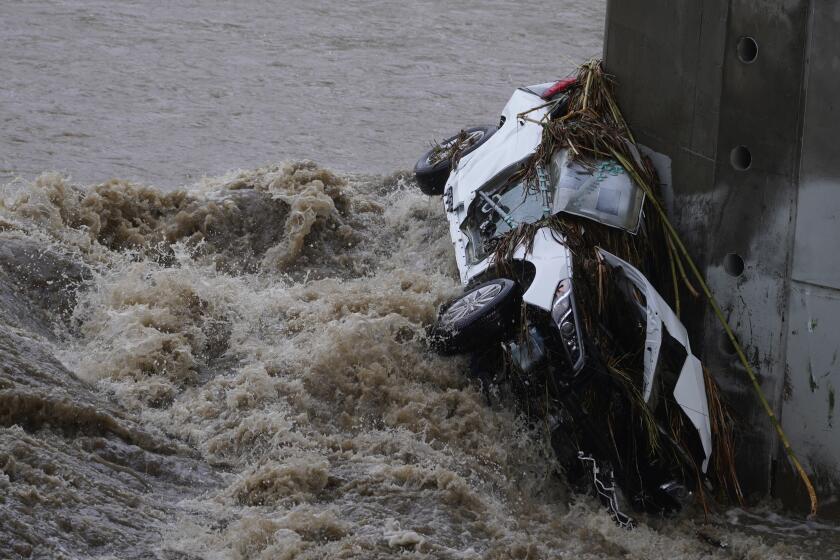
It was alarming to discover just how bad the pollution has been in the lower L.A. River, the report noted, especially along areas that are not meant for recreation but still used for swimming and fishing. Homeless communities have also relied on this part of the river for washing and other needs.
Bacteria levels along this stretch of river were more than 10 times higher than what the U.S. Environmental Protection Agency considers safe.
Tracy Quinn, who became Heal the Bay’s new president in May, said that expanding the river report card is a big priority. Gov. Gavin Newsom signed new legislation last October that tasks state officials with identifying every lake, river and stream in California that should be monitored for public health risks.
Southern California needs to capture and reuse more of its rainfall while Northern California needs to keep more of it flowing to the sea.
Quinn, who formerly oversaw California urban water policy at the environmental group Natural Resources Defense Council, is also advocating for more projects that can absorb and clean urban runoff, while also doubling as parks — providing much-needed green space for inland communities. Our built environment and our health, she said, are ultimately inseparable.
“We have replaced natural landscapes with impervious streets and structures and that has resulted in high pollution loads in our rivers and in our ocean,” she said. “When we’re talking about coastal water quality, we need to think of it as a watershed issue. We need to address this from summit to sea.”
More to Read
Sign up for Essential California
The most important California stories and recommendations in your inbox every morning.
You may occasionally receive promotional content from the Los Angeles Times.
