- Share via
The Los Angeles Times spent months researching and analyzing firearms dealer and gun violence data for its recent series on gun access. The analysis found:
- Nearly everybody in the U.S. lives within a 10-minute drive of a gun dealer.
- Compared with a decade ago, guns pass more quickly from store shelves to crime scenes as police recover record numbers of firearms.
- Reducing gun homicides by 1% in a given county would require unprecedented coordination among neighboring governments to shut down dealers, calling into question the impact of expanding municipal gun restrictions.
These findings just scratch the surface. The Times dug through hundreds of pages of reports, filed numerous federal, state and local public records requests, and compiled and analyzed the available data. Over and over again, walls blocked the path forward. Primarily, the research was limited by laws that specifically restrict public access to even basic information about gun sales and gun crimes.

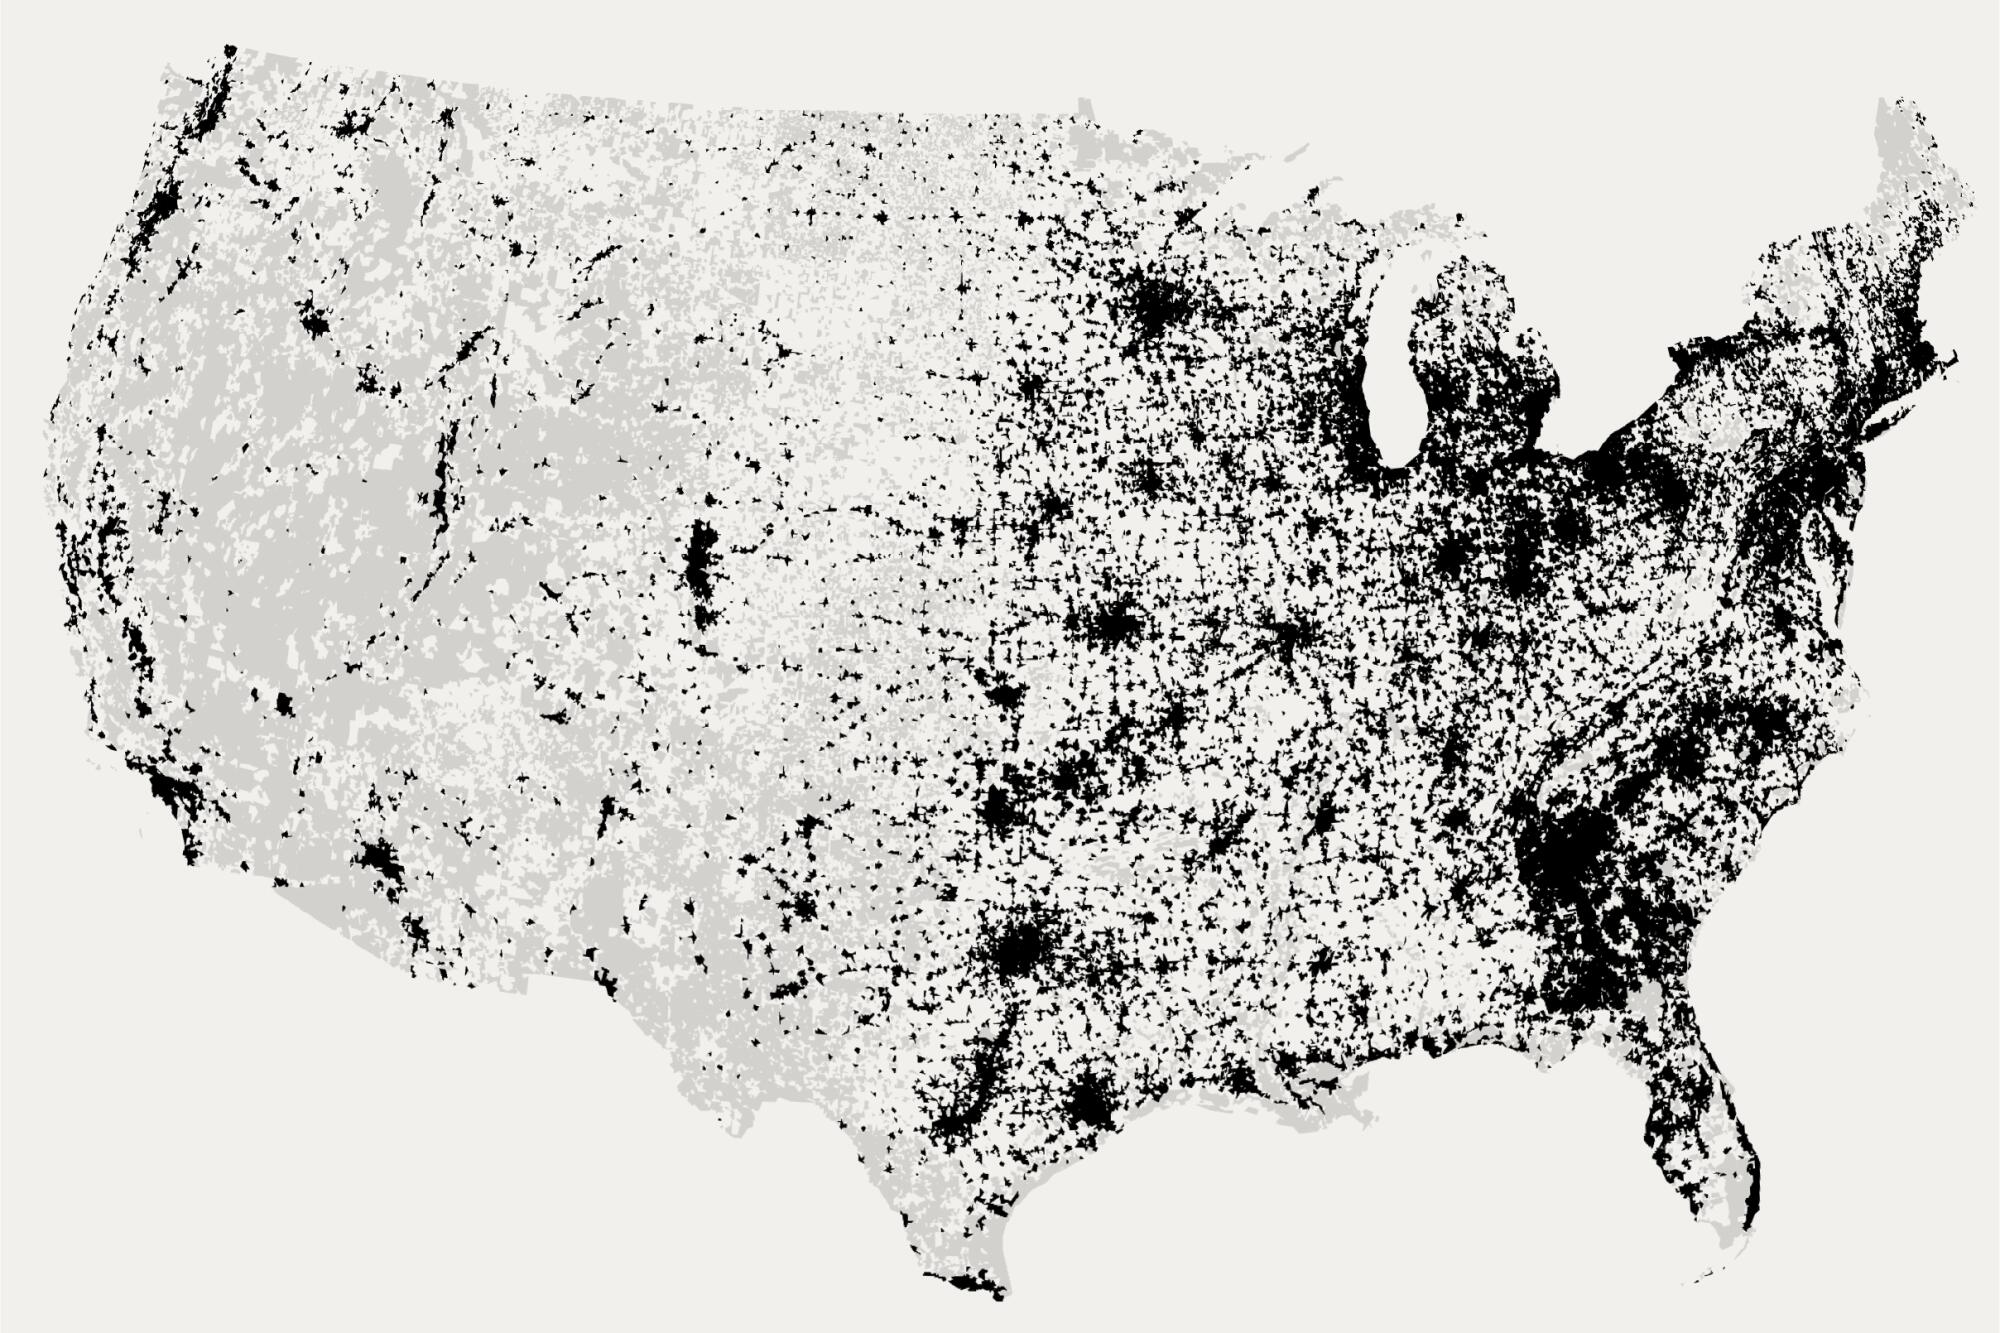
Most Americans live within 10 minutes of a gun store. The Los Angeles Times set out to determine whether easy availability is a key driver of gun violence — but it’s not that simple. This series explores the complex relationship between firearm access and gun crime.
“Data are either not collected or not aggregated or not made available,” said Garen Wintemute, director of the UC Davis Violence Prevention Research Program. “All of it to keep us from understanding this problem so we can do more to prevent it.”
Find code and more details about the process on our github page.
How many gun dealers are there?
The most comprehensive data available about gun dealers are from the list of federal firearms licensees published online by the Bureau of Alcohol, Tobacco, Firearms and Explosives every month since 2014. It includes basic information about each license holder such as business name, type of license and address. The Times also included lists from 2003 to 2013 obtained through a Freedom of Information Act request.
2023 began with nearly 79,000 licensees that sell guns, the most at the start of any year for the last two decades.
There are licensed gun dealers in virtually every corner of the country, though some places, such as Tarrant County, Texas, and Macomb County, Mich., have many more per capita and per square mile. Additionally, some states have seen large increases in dealers while others have had substantial declines since 2003.
By plotting dealer addresses and calculating driving times to each, we determined 88% of the U.S. population is within a 10-minute drive of a gun dealer.
California gun dealers require a state license in addition to their federal firearms license. The state Department of Justice maintains the Centralized List of Firearms Dealers, which The Times requested to compare it with the federal list. The department denied the request based on a state law that allows disclosure of information from the list only to law enforcement and for specific firearm business reasons, such as gun show participation eligibility.
Wintemute said information about gun sales was easier to obtain when he started his research in the late 1980s.
“As researchers, the data were easy to get. For 30 years, basically we had data on every gun sold in the state. Who sold it, who bought it. Details on the gun so we can follow [it],” he said. “You will not be able to get the data that I’ve been talking about. We can’t either anymore, and I’m hoping things will change.”
Where do the guns used in crimes come from?
Most of what we know about guns used in crime is from limited federal, state and local law enforcement reports. When law enforcement officers recover a gun during a criminal investigation, they can ask the ATF to trace it to get information such as the dealer who first sold the firearm and the person who purchased it. The federal agency produces reports with aggregated data annually, but results for an individual gun or counts of traces linked to an individual dealer are much harder to obtain.
The Times filed requests for trace information to the ATF and multiple local law enforcement agencies including the Los Angeles police and county sheriff’s departments. All the local agencies either denied the requests or deferred to the ATF.
The Consolidated Appropriations Act of 2005, however, explicitly bars federal funds from being provided to the ATF to disclose gun trace information except to law enforcement agencies for bona fide investigations.
In 2022 and 2023, under the direction of the Biden administration, the ATF published for the first time in 20 years two installments of a report on firearms commerce and trafficking. Using data from 2017 to 2021, the report showed declining time to crime, a measure of the time between a firearm’s sale and its recovery by law enforcement as part of a criminal investigation.
The Times pulled and analyzed time-to-crime figures from the ATF’s firearms trace data summaries published between 2006 and 2022, and found the average time remained steady until 2015, when it started to decline. The data also showed an increase in the overall number of traces.
The time-to-crime data also track where crime guns come from at the state level. The percent of crime guns sourced in a state is an indicator of how easy it is to get a gun there, according to a 2018 study. In California in 2022, 52% of crime guns came from California dealers, the ATF data show, followed by 14% from Arizona and 7% from Nevada.
In June, the California Justice Department published its own analysis of crime guns purchased and recovered between 2010 and 2022. This report showed vast differences in the volume of firearms sold at each retailer and revealed the dealers with a higher percentage of their guns recovered by law enforcement. The Times found just one other state, Pennsylvania, that publishes aggregated counts of crime guns traced to individual dealers.
Still, many California law enforcement agencies claim they do not have to disclose records of guns involved in crimes if they are part of an investigation — even after an investigation ends. While they don’t have to disclose investigative records, they are supposed to disclose to the public a general description of weapons involved when requests for assistance are made to law enforcement.
Do more gun dealers mean more shootings?
One additional dealer every 100 square miles can increase homicides up to 4%, a 2021 study found.
Authors David Johnson, associate professor of economics at the University of Central Missouri, and Joshua Robinson, associate professor of economics at the University of Alabama at Birmingham, argued that dealers per square mile is the best metric to estimate access to firearms and gun prevalence in a given place. Still, limitations exist. Some licensees are avid collectors who want the freedom to purchase in high volume, for example, while others are repair shops or security services.
The Times replicated Johnson and Robinson’s analysis using the ATF’s federal firearms license lists from 2009-2019 and Centers for Disease Control and Prevention homicide data from 2011-2021 to allow for a two-year lag on homicides because firearms leaving newer gun dealers take time to end up in crimes. The analysis accounted for repair shops and other non-dealers by comparing the ATF license list and sellers listed on GunBroker.com, an online marketplace for firearms and accessories.
A county-level regression model accounted for differences over time. The analysis also included characteristics such as the percent of people living in poverty, and percent of Black residents, both known to influence homicide rates based on Johnson and Robinson’s study and others.
Johnson’s analysis and The Times found a stronger relationship between dealer density and homicides when considering sellers in a county and its neighbors rather than the county alone.
According to Johnson’s study, one additional dealer per 100 square miles in a county corresponds to a 2% increase in gun homicides two years later. That increase doubles when dealers in neighboring counties are also considered.
The Times analysis showed a 4.8% increase in gun homicides from one additional dealer per 100 square miles in a county and neighboring counties.
The effect was greater for counties that already had high homicide rates, those experiencing high levels of poverty, and those with large Black populations, a reflection of the enduring impact of generations of racist policies and underinvestment in low-income communities.
The Times consulted with David Johnson and Dan Semenza, who generously set aside time for multiple discussions throughout the process. A list of research that informed the reporting and analysis follows below.
- Gun Dealer Density and its Effect on Homicide. David B. Johnson and Joshua J. Robinson
- Firearm Dealers and Local Gun Violence: A Street Network Analysis of Shootings and Concentrated Disadvantage in Atlanta. Daniel C. Semenza, Elizabeth Griffiths, Jie Xu and Richard Stansfield
- Relationship Between Licensing, Registration, and Other Gun Sales Laws and the Source State of Crime Guns. D.W. Webster, J.S. Vernick, and L.M. Hepburn
- Homicide and Geographic Access to Gun Dealers in the United States. Douglas J. Wiebe, Robert T. Krafty, Christopher S. Koper, Michael L. Nance, Michael R. Elliott and Charles C. Branas
- State Firearm Laws and Interstate Transfer of Guns in the USA, 2006–2016. Tessa Collins, Rachael Greenberg, Michael Siegel, Ziming Xuan, Emily F. Rothman, Shea W. Cronin and David Hemenway
- Licensed Firearm Dealers, Legal Compliance, and Local Homicide: A Case Study. Richard Stansfield, Daniel Semenza, Jie Xu, Elizabeth Griffiths
More to Read
Sign up for Essential California
The most important California stories and recommendations in your inbox every morning.
You may occasionally receive promotional content from the Los Angeles Times.


