What the numbers show about UCLA’s sparkling season

- Share via
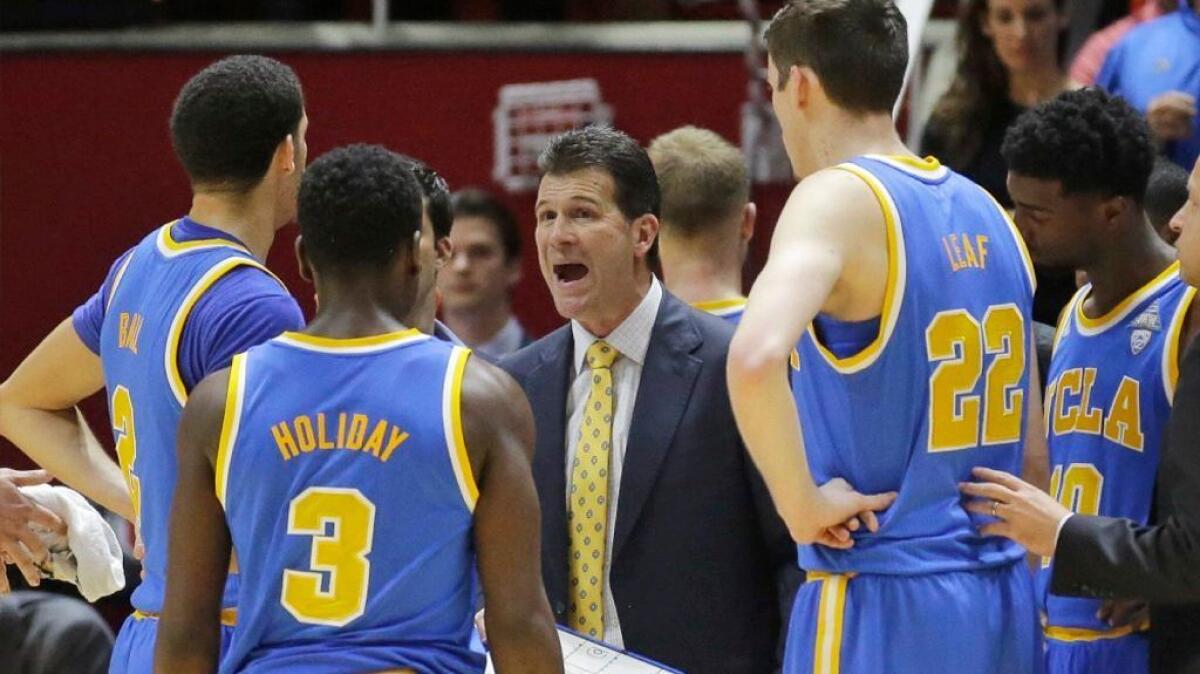
The numbers that tell the story behind college basketball’s Showtime offense cannot be found on the Pauley Pavilion scoreboard.
They’re written on a whiteboard inside the UCLA locker room, where they are pondered, celebrated and occasionally met with disbelief.
UCLA’s goal is to score 110 points per 100 possessions, which would put it among the top offenses in the country. A handful of games, the Bruins have soared into the 140s.
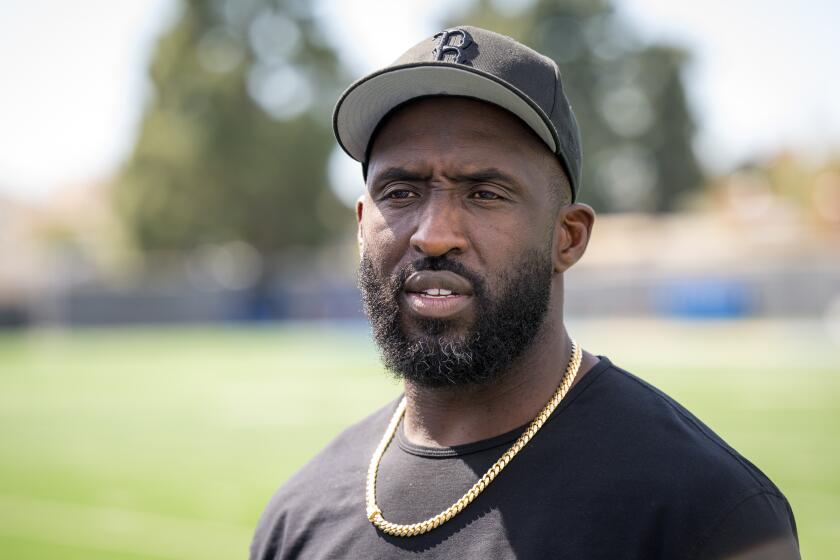
“Kory, our analytics guy, is like, ‘That’s ridiculous,’ ” Bruins senior guard Bryce Alford recalled this week, referring to his older brother, the team’s video and analytics coordinator. “ ‘Nobody does that.’ ”
Well, almost nobody. The third-ranked Bruins have made the impossible seem routine and possess the figures to illustrate it. They can measure the efficiency of their famed four-guard lineup versus a more traditional one with two big men. They can determine which players shoot the highest percentages while having their shots contested. They can count the number of times the team runs a particular play, along with its success rate.
Coaches revised the team goal board before the season to reflect the 12 metrics they wanted to emphasize. Gone are traditional measures such as points allowed, replaced by the more advanced defensive efficiency, which also accounts for the varying pace of games.
“It’s definitely a new thing,” Bryce Alford said of the analytics. “My freshman year, we didn’t look at it at all and now we look at it quite a bit.”
The Bruins like what they’ve seen of their offense, which leads the country in efficiency, is No. 3 in scoring at 92.9 points per game and has met its scoring goal per 100 possessions in 16 of 19 games. Their defensive numbers have been far less impressive. UCLA ranks No. 102 nationally in defensive efficiency even when adjusting for its furious pace, according to the computations of analytics expert Ken Pomeroy.
The numbers seem slightly less unpleasant when you consider that the Bruins have met their goal of allowing 95 points per 100 possessions in 12 of 19 games. It also doesn’t hurt that UCLA has won 18 of 19 games.
“If we can get both,” Alford said of the offensive and defensive efficiency numbers, “I think it comes out to like a 98% chance to win or something like that.”
UCLA uses a hodgepodge of analytics gleaned from databases such as Kenpom.com and Basketball-Reference.com, as well as in-house computations by Kory Alford that are based on video analysis. He presents his findings to the coaching staff through colorful charts and graphs that make the data easier to digest than a pile of raw numbers. That information is passed on to players through scouting reports and the goal board.
One chart Alford recently showed a visitor illustrated how the Bruins ran the fewest pick and rolls in the Pac-12 Conference even though they were the most efficient team in the conference on those plays. A discussion ensued about whether it should be an impetus to run more pick and rolls or whether the increased volume might hinder UCLA’s efficiency.
“Some people see analytics as providing an answer,” Alford said. “To me, it’s providing a question to where you need to go and find the answer.”
UCLA Coach Steve Alford was unequivocal in his desire for his team to take more three-pointers this season, in part because his roster featured seven rotation players who could make shots from long range. Another reason was Kory Alford’s chart showing how the Bruins had lagged behind the NCAA average for the percentage of three-point shots in recent seasons while also allowing their opponents to take too many three-pointers.
Those numbers have flipped this season, with UCLA taking 39.0% of its shots from three-point range while allowing opponents to take 33.0% of their shots from beyond the arc. The NCAA average is 36.2%
Three-pointers in transition are especially coveted because statistics have shown they are among the most efficient shots from that distance besides uncontested, spot-up three-pointers. The Bruins have made 43 three-pointers in transition, more than doubling their output from last season with roughly half a season to go.
Contrary to appearances, basketball analytics are old news. Kory Alford ran the cursor on his laptop over 2002 on Kenpom.com to show how far back the archives go.
“The acceptance is what has grown,” Alford said. “It’s been here, but where people actually understand what it means and actually go to it religiously, I think that is new.”
Alford, the former UCLA walk-on guard who wants to follow his father’s path and become a college head coach, said he believes there’s a balance that should exist between old-school savvy and the analytics movement that has become deeply entrenched in professional basketball. NBA teams use sophisticated motion-tracking cameras that provide an additional set of data that includes every player’s speed on the court in miles per hour.
Alford said UCLA has pushed for the purchase of those cameras in Pac-12 arenas and hopes they’re only a few years away from installation. That might be the only way to effectively measure guard Lonzo Ball’s otherworldly pace, though Alford points to one metric that illustrates the freshman’s unselfishness.
Ball’s usage rate is 18.9%, which means that roughly one-fifth of UCLA’s possessions end with him either taking a shot or turning the ball over. That’s unusually low for someone who is a national player-of-the-year candidate and displays his ability to involve his teammates. By comparison, Washington’s Markelle Fultz has a 34.4% usage rate and Oregon’s Dillon Brooks has a 33.4% usage rate.
Ball and the Bruins have made it fun to be a numbers junkie.
“Obviously, when you have a team like we have where we’re literally breaking offensive records,” Kory Alford said, “it’s a blast as an analytics person.”
::
UCLA TONIGHT
VS. ARIZONA STATE
When: 8.
Where: Pauley Pavilion.
On the air: TV: FS1; Radio: 1150.
Update: UCLA has a 10-game home winning streak and is trying to win 19 of its first 20 games for the first time since the 1991-92 team started 21-1. The Bruins (18-1 overall, 5-1 in Pac-12 play) also need a victory to keep from slipping further behind Oregon and Arizona, which remain unbeaten in conference play. Junior guard Tra Holder averages a team-high 16.9 points per game for Arizona State (9-9, 2-3), which is coming off back-to-back losses to Utah and Arizona. If you wonder why Holder wears No. 0, he has said it’s because he will have zero excuses.
Follow Ben Bolch on Twitter @latbbolch
More to Read
Go beyond the scoreboard
Get the latest on L.A.'s teams in the daily Sports Report newsletter.
You may occasionally receive promotional content from the Los Angeles Times.


