The election prediction game: The winners and the losers

- Share via
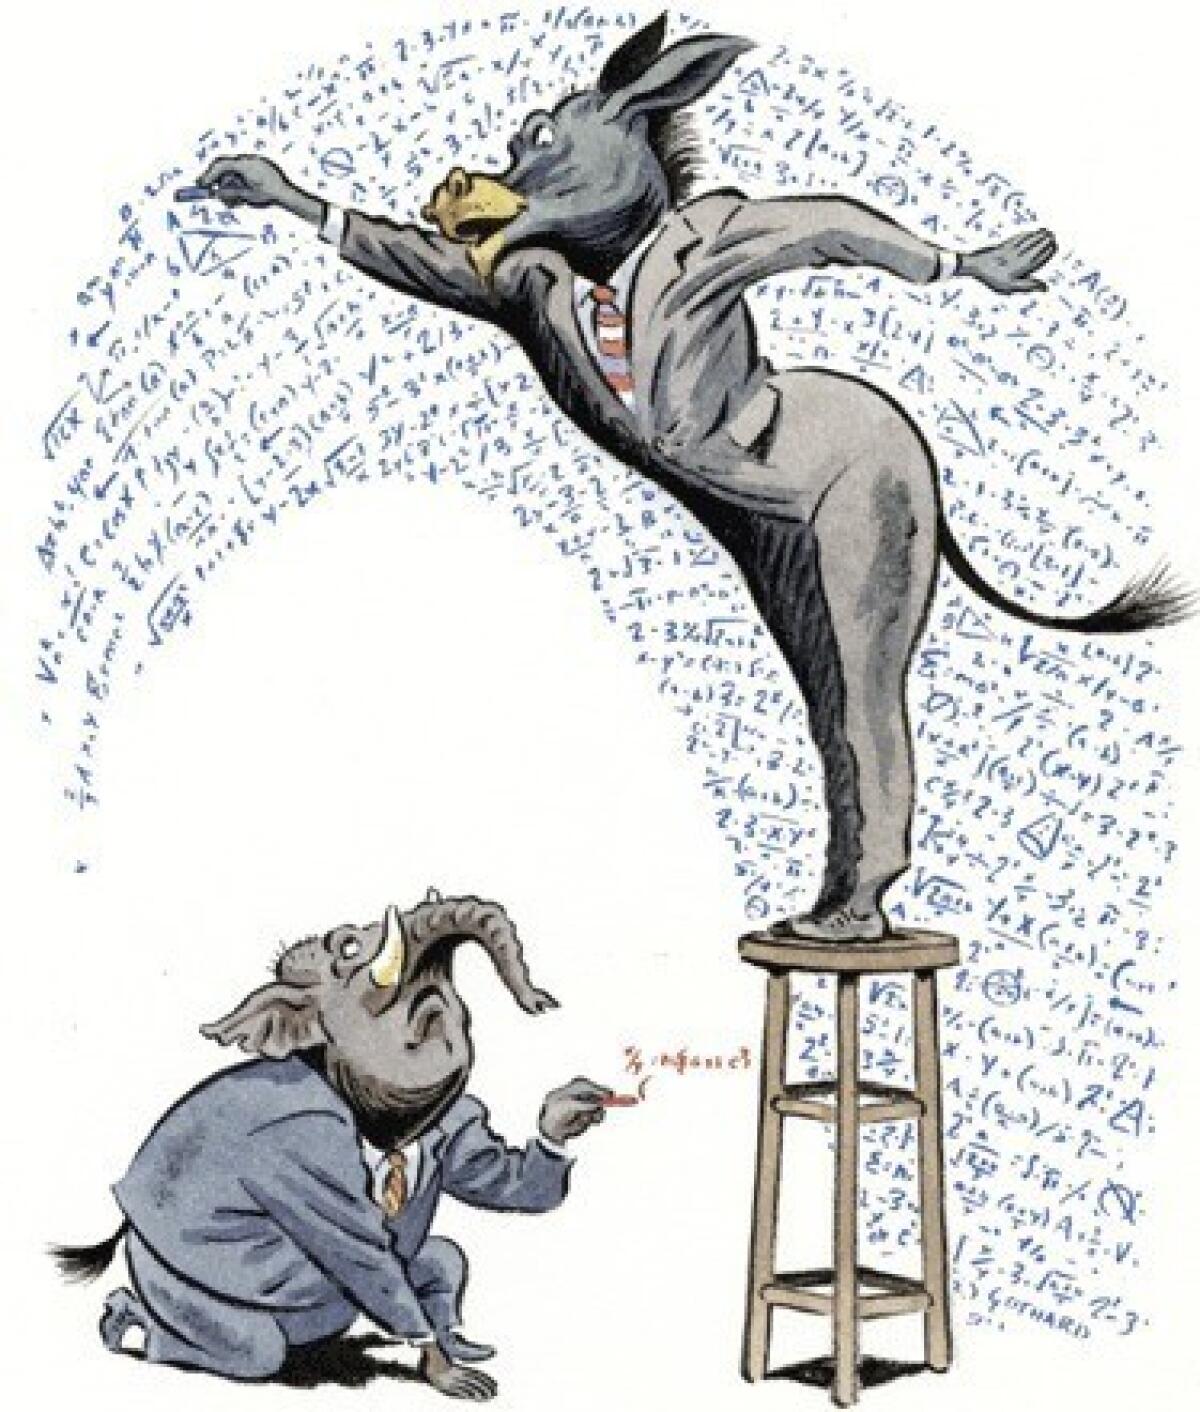
During the long presidential campaign, pundits, polls and prognosticators of all stripes weighed in on the final outcome. Some were brave enough to commit to actual numbers on the electoral vote count. The Times asked a few to talk about how they arrived at their predictions and why they got them right — or wrong.
LOSERS:
Kenneth Bickers and Michael Berry are professors of political science at the University of Colorado Boulder and the University of Colorado Denver, respectively. Romney 330 / Obama 208.
Our state-level economic model incorrectly projected the outcome of the presidential election. So this Thanksgiving when others are eating turkey, we’ll be having crow.
Our model projected state results based on the vote in the 2008 election, the unemployment rate and changes in personal income. Historically, these metrics and incumbent performance have been strongly correlated. In 2012, unemployment remained high by historical standards and income growth was stagnant, meaning that President Obama faced significant head winds. Given these challenging economic conditions, he accomplished something rare by winning a second term.
Although the model proved incorrect, it nevertheless provides a baseline for beginning to analyze exactly how the incumbent party outperformed a poor economy. It appears now that campaign effects were unusually large and decisive, such as the early attack ads on the Republican nominee and the positioning of women’s issues at the campaign’s forefront.
Obama’s success is also attributable to a better ground game. His field offices in battleground states more than doubled those of Mitt Romney. The mobilization of Democratic-leaning voting blocs was impressive. The Latino and youth vote — key to Obama’s win in 2008 — increased their share of the electorate in 2012, each breaking decisively for the president.
Lastly, the president clearly benefited from the “October surprise” of Superstorm Sandy. Exit polls indicate that 41% of voters claimed that the president’s response to the disaster influenced their vote, with 15% stating that the response was the single most important factor when they cast their ballot for the nation’s highest office.
Benjamin Domenech is a research fellow at the Heartland Institute and editor of the Transom. Romney 278 / Obama 260
My prediction of a narrow 278-260 victory for Romney was based on the assumption that the high turnout for Obama in 2008 would revert toward the historical mean. I’m generally skeptical of the top lines of polls, and I relied on consistent signs from key demographics in October that pointed toward a Romney victory. Romney’s support remained constant after adding Paul Ryan to the ticket, which also healed the rift with the conservative base. In the wake of the presidential debates, Obama’s base showed signs of being less engaged, less active and less eager to vote than in 2008. Meanwhile, Romney appeared to be gaining ground in the white religious sector, just as Obama’s contraception and abortion stands caused concern among religious groups. Church attendance is one of the best signifiers of voting likelihood, and I believed this would help Romney among the white working class in the Midwest, mitigating the damage from his “47%” video and more.
However, this election instead turned out to be what Obama’s Chicago brain trust claimed it would be: one in which Republicans were hampered by an out-of-touch candidate simultaneously deemed heartless and severe. The Democratic ground game proved vastly superior and the president’s lost ground among white voters was made up for by maximizing the minority and youth vote. Although Obama got 9 million fewer votes than in 2008, Romney added only two states to John McCain’s electoral total. And while Romney won voters ages 30 and up, and even won white voters under 30, young minority voters just crushed him, delivering historic highs for Obama among Asians and Latinos.
Exit polls found that the majority of Americans simply did not believe Romney cared about people like them. Bill Clinton once said that the No. 1 rule of competitive politics is having a narrative rooted in the lives of people. Until Republicans get that right, they are unlikely to expand on their increasingly homogenous 48% of the electorate.
Dave Weigel is a political reporter at Slate.com: Prediction: Romney 276 / Obama 262.
I traveled to every swing state this year, which gave me a somewhat false sense of what they were actually like. The Republican effort in Virginia looked strong, bolstered by new outreach to the Asian community. The Colorado suburbs seemed to have fallen away from the Democrats.
If I were Romney, I’d say that conservatives gave me just about the greatest brainwashing you can have. While I didn’t doubt the polls, I assumed that more ties would go for the Republicans because so many of their 2008 losses could be traced back to McCain’s meandering campaign and low base enthusiasm.
For all that, I flipped my prediction at the last minute, seeing that Ohio would stay in the Obama camp. I was wrong, but less wrong.
WINNERS:
Sam Wang is an associate professor of molecular biology and neuroscience at Princeton University and founder of the Princeton Election Consortium. Obama 303, Romney 235.
I promised my readers that if I was wrong in my prediction about the outcome of the presidential race, I would eat a bug. I didn’t have to pay up. I called 50 out of 50 races correctly, as well as the popular vote and 10 out of 10 close Senate races.
I did this by analyzing polls, relying on the fact that individual pollsters may make small errors but, as a group, they are wise. Applying the right statistical tools collects their wisdom to give a sharp picture of one race — or of the electoral college. For example, if we at the consortium have three polls for Ohio showing Obama up by 3, Obama up by 2 and Romney up by 3, then the middle value — the median — is likely to be closest to the true result. This kind of information can be used to calculate the odds that a candidate is ahead. Combining the probabilities requires more advanced math.
We used similar approaches to pinpoint the race’s pivotal events. Michelle Obama’s speech at the Democratic convention, for example, improved 20 million opinions about her husband’s job performance — overnight. And the largest swing in candidate preference occurred after the first debate, when Romney nearly closed the gap with the president. However, this change did not last long.
Why did experienced pundits such as Karl Rove fail in their predictions? Those who expected Romney to win were selectively questioning polls that they found disagreeable. When evaluating hard data, it is essential to avoid such reasoning errors, whether with polls or with evidence for climate change. On Tuesday we saw an example of the consequences.
Drew Linzer is an assistant professor of political science at Emory University. Obama 332 / Romney 206
On Nov. 6, I predicted that Obama would win 332 electoral votes, with 206 for Romney. But I also predicted the exact same outcome on June 23, and the prediction barely budged through election day.
How is this possible? Statistics. I did it by systematically combining information from long-term historical factors — economic growth, presidential popularity and incumbency status — with the results of state-level public opinion polls. The political and economic “fundamentals” of the race indicated at the outset that Obama was on track to win reelection. The polls never contradicted this, even after the drop in support for Obama following the first presidential debate. In fact, state-level voter preferences were remarkably stable this year; varying by no more than 2 or 3 percentage points over the entire campaign (as compared to the 5% to 10% swings in 2008).
The actual mechanics of my forecasts were performed using a statistical model that I developed and posted on my website, votamatic.org. While quantitative election forecasting is still an emerging area, many analysts were able to predict the result on the day of the election by aggregating the polls. The challenge remains to improve estimates of the outcome early in the race, and use this information to better understand what campaigns can accomplish and how voters make up their minds.
Markos Moulitsas is the founder and publisher of Daily Kos. Obama 332 / Romney 206.
This election delivered a triumph to data junkies — those of us who view politics through numbers as opposed to ideological conceits or biases. At Daily Kos, we have long prided ourselves on our slavish devotion to that data. How can we move the nation toward a more progressive path unless we accurately understand the public?
We partnered with the pollsters at Public Policy Polling, which was just declared the most accurate pollster of 2012 in a Fordham University study. But I never rely on any single point of data. By definition, five out of every 100 polls will be wrong, and the more polling responses you aggregate, the smaller the margin of error. So I did what the smartest political prognosticators did: lump all the polling together and average it out.
I then predicted the vote differentials in the nine battleground states and the national vote. I was within 2 percentage points of the final results in eight of the 10. None of this required any fancy insider sources — just a realization that political campaigns aren’t magic, and a handy-dandy calculator.
Larry Sabato is the director of the University of Virginia Center for Politics and editor of the Crystal Ball newsletter. Obama 290 / Romney 248.
Before the presidential election, many conservatives claimed that the polls were biased against Romney. If they had been right, we would have been very wrong in our predictions — polling averages are a big part of how we make our pre-election calls. As it turned out, the poll averages were generally right, just as they were in June when Republican Gov. Scott Walker of Wisconsin won his recall victory amid Democratic grumbling about polls. Those averages, along with electoral history and our private conversations with insiders on both sides, informed our picks. We called 48 out of 50 states correctly, assuming that Florida goes for Obama.
The Crystal Ball is distinctive in that we call every contest for the Senate, the House and governor, in addition to the electoral college; we leave no toss-ups on the table. We selected 31 of 33 Senate winners and, assuming the leaders in races not yet called eventually prevail, 10 of 11 gubernatorial winners and about 97% of the 435 House races. Again, these selections are based on polls (when available), electoral history, election modeling and conversations with our sources.
The real question is, why try to predict winners that will be known for sure in due time? For us, the answer is easy. The central mission of the UVA Center for Politics is civic education. Prognostication is a useful, enjoyable hook to get people talking about politics. We link our Crystal Ball to our Internet mock election for elementary and secondary students — the largest such election in the nation, with 2 million votes cast this year.
More to Read
A cure for the common opinion
Get thought-provoking perspectives with our weekly newsletter.
You may occasionally receive promotional content from the Los Angeles Times.


