Sandag Survey Reveals Traffic Growth Details
- Share via
A father’s middle-of-the-night dash to an emergency room with his asthmatic youngster.
A teen-ager’s skateboard slalom down to the beach to check out the surf.
A Navy wife’s trip across the bridge to Coronado with her three children to meet the ship bringing her husband home for the first time in six months.
A Padre fan’s bumpy bus ride to San Diego Jack Murphy Stadium to watch his team get walloped.
All these events and thousands of others that occurred during a one-day slice of life for 2,600 San Diegans will be woven together to create a “travel profile” of the region--a once-a-decade effort that could affect such things as freeway construction, the price of housing and the timing of traffic lights.
The 1986 trip survey of each of 2,600 county residents selected at random to trace his or her travel pattern for a day--4 a.m. until midnight. Each auto trip, each walk from a parking garage to workplace, each stop to fill the gas tank or pick up a loaf of bread, became grist for the computer profile of county traffic. An after-work walk on the beach, an early-morning jogging session, a bus ride to a shopping center, all were charted by time and location.
Results of the San Diego Assn. of Governments (Sandag) survey that began in February and concluded in July are still being fed into computers. Only unadjusted raw data is available, but that preliminary glimpse spells major headaches for transportation planners and commuters alike.
One Sandag planner who perused the data predicted that “the bottom line will be gridlock before too many years.”
Some of the disturbing trends that have emerged in comparing the 1986 rough data to the results of a 1977 Sandag trip destination survey are:
- The average San Diego County household is generating 20% more vehicle trips than a decade ago. Add to that the increased number of households in the county and the increase in traffic congestion is obvious. The average daily household trips totaled 9.8 in the 1977 study; the raw data from the 1986 survey indicate an average daily household trip total of 11.8.
Lois Fonseca, a Sandag official in charge of this year’s trip survey, said: “In the 1977 study (of 1,000 persons), the highest number of (daily) household trips recorded was 49. This time we broke that record in the first few weeks. This time we had one family with 101 trips, although admittedly the husband was a bottled water delivery man.” (Each delivery counted as a trip under Sandag definitions.) “One family surveyed (this year) had 10 family members and 68 (daily) trips, all of them normal trips to and from shopping, work, school, recreation and so forth,” Fonseca said.
- The percentage of trips on mass transit dipped below 1% of total trips taken in the 1986 survey, buoyed by school bus ridership to 2.7% of the trip total. The 1986 study showed only .9% of the trips were on public bus and trolley, compared to 1.5% transit trips in the 1977 survey. School bus ridership boosted the 1977 bus ridership up to 3.8%.
The county’s seven transit systems, with 472 buses and 24 trolley cars on 86 routes, carried more than 34 million passengers in 1985, yet accounted for less than 1% of the trips taken in San Diego County, according to preliminary figures from the 1986 survey.
- Automobile trips, on the other hand, have risen sharply in the 1977-86 decade, accounting for 77.3% of all trips in 1977 and 88.4% in the current survey. More than 51% of the current automobile trips are taken by solo drivers, according to the preliminary figures from the 1986 survey. In the 1977 survey, only about 35% of the drivers were alone in their vehicles.
- Trip times also have increased. The average auto trip in 1977 was 9.3 minutes in length. The current survey shows the average auto trip lasts 14.8 minutes--a 59% increase in driving time--but still far below the average 1986 bus-trolley trip of 41.1 minutes. Whether the time increase is due entirely to longer trips or whether some of the increased travel time is due to traffic congestion has not yet been determined from the 1986 data.
- The comparison of data indicates that the number of trips per household increases with increases in household income. Household income in the San Diego region is going up faster than inflation.
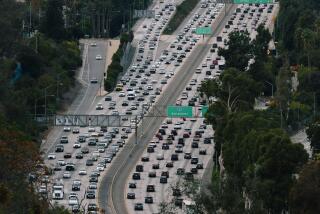
Add up all the trends--more drivers, more vehicles, more trips per household, more driver-only trips, longer trip times, lower transit ridership rates, higher household incomes--and the message that the 1986 Sandag trip survey delivers is more traffic congestion, eventual gridlock.
Fonseca and fellow survey leader Paul Kavanaugh point out, however, that traffic is not a one dimensional problem. When the Bay Area Rapid Transit system began fast rail service from Alameda, Berkeley, Oakland and environs into downtown San Francisco, auto commuters in the San Francisco Bay area expected to reap rewards in terms of less-crowded freeways. It didn’t happen. There were just as many cars crossing the San Francisco-Oakland Bay Bridge during rush hour after BART service began as there were before.
Where did all the extra commuters come from? The two Sandag analysts can only speculate that the drivers who previously had avoided the rush-hour commute times by arriving at work earlier or later than normal, went back to their normal commute times. Or, perhaps, cross-bay car pools dissolved when one or more members switched to BART--producing two or three solo commuters instead of a single four-occupant vehicle. Or, more probably, a variety of adjustments occurred that brought rush-hour traffic back up to the frustration level that drivers were willing to bear.
A trip survey such as the one recently completed in San Diego County would have answered the San Francisco traffic questions and will answer similar questions that are puzzling traffic engineers here.
Once Sandag traffic analysts tabulate the average day’s movements of the microcosm of San Diego County humanity participating in the trip survey, sophisticated computer programs can project the figures into predictions of future traffic volumes and the when and where of future traffic bottlenecks. Computer-created models of solutions--new roads, widened thoroughfares, improved freeway interchanges--can be tried on for size and tested for effectiveness before a tax dollar is spent.
The insights into driver behavior that the trip survey reveals can direct traffic planners toward solutions but can’t guarantee that the solutions will be long-lasting or that they will not cause more traffic problems than they cure.
Take California 56, touted by state Department of Transportation engineers as a necessary east-west artery through the north-central portion of the county. When California 56 is built linking Interstate 5 at Del Mar to Interstate 15 at Rancho Penasquitos, it will ease congestion on other east-west roads in the area--Mira Mesa Boulevard and Miramar Road--but will boost traffic on the already-congested lanes of Interstate 5 past Del Mar to 260,000 vehicles per day--double the capacity of an eight-lane freeway. Without the east-west California 56, traffic on the Interstate 5 stretch would still be congested, but would be carrying about 100,000 fewer vehicles a day.
Kavanaugh, a weekday auto commuter from Encinitas to downtown San Diego, pointed out that gridlock is only an accident away on most of the region’s main arteries. If one lane of any freeway is blocked by an accident or by a Caltrans maintenance crew during rush-hour traffic flows, the stop-and-go pattern which is a way of life on most Orange County and Los Angeles County arteries occurs in San Diego.
The survey points toward other ways to reduce traffic congestion than road building, though they may not be easy to implement. If the number of riders per car could be doubled during peak traffic hours, the San Diego commute would be smooth and trouble-free. More than half of San Diego drivers are alone, the trip survey showed. That percentage of solo drivers increases during night and morning home-to-work commutes, when traffic congestion is at its worst.
At other times, a cure for traffic congestion is too bitter a political pill to swallow, the Sandag planners point out. Rush-hour traffic to the county’s main employment hub--downtown San Diego--could be controlled by banning all-day on-street parking around the city’s center and doubling the cost of off-street parking spots. Such drastic economic measures, not under consideration at present, could reduce commuter auto traffic to downtown by 5% to 10%, Kavanaugh pointed out.
Fonseca is concerned that the recently completed survey be reliable for planning future road-building and land use. So she is worried that an unusually large number of randomly-selected persons turned down the Sandag surveyors.
Fonseca blames the turndowns on the use of the telephone for recruiting. Her survey crews had expected to complete the recruitment and interviews of the 2,600 survey participants in about 10,000 telephone calls. Instead, she said, the telephone contacts numbered closer to 20,000, indicating “excessive turndowns, probably because people are wary about telephone solicitors and were afraid that, if they agreed to participate, some sort of merchandise would show up in the mail box.”
More to Read
Sign up for Essential California
The most important California stories and recommendations in your inbox every morning.
You may occasionally receive promotional content from the Los Angeles Times.
