Traffic Report Card Goes From F to Worse : Transportation: Peak-hour speed on 75% of county freeways is less than 20 m.p.h. Options for combatting congestion, such as more synchronized signals, are being studied.
- Share via
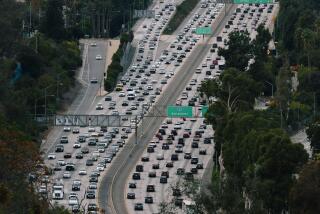
If you have spent any time at all on Los Angeles streets and freeways, no one has to tell you that there are few signs of traffic congestion easing much.
But just to show how much worse it is out there, transportation officials released a traffic report card Monday that looks like a student’s nightmare: failing grades abound, and passing marks are rare.
Congestion at many intersections has gotten so bad that traffic experts this year had to come up with a new scale to differentiate the bad from the even worse from the truly hideous.
The plan measures congestion on surface street intersections and freeway corridors with a rating of A to F--with A representing free flow and F signifying near gridlock.
But congestion is so overwhelming on some roads that traffic experts this year have added new levels of the F grade: F(a), F(b), F(c) and F(d). The longer an intersection is clogged to the F level, the lower its grade, ranging from less than one hour on a stretch of freeway--an F(a)--to more than three hours within a peak-traffic period, which gets a F(d).
The report card for 1992, formally known as the Congested Corridor Action Plan, concludes that countywide, 34% of surface street intersections have standstill delays of more than one minute and 75% of freeways have a peak-hour average speed of less than 20 m.p.h.--widely used benchmarks of traffic flow.
Because the 1991 analysis did not include intersections, transportation officials said it is difficult to compare the 1992 report with it.
However, traffic experts from the California Department of Transportation said that at least on the freeways in Los Angeles County, traffic has increased generally from 1% to 2% between 1991 and 1992.
The report card, an idea proposed in 1991 by Los Angeles County Supervisor Ed Edelman, a member of the new Metropolitan Transportation Authority, identifies the 11 most congested corridors, gives updates on traffic reduction strategies implemented since 1991 and recommends new options for combatting congestion.
The 11 congested corridors include the busiest freeways and surface streets from Santa Monica to San Bernardino to San Pedro. They are generally the most heavily used commuter routes and include some of the most active business areas.
Despite the failing grades on many freeways and intersections, Edelman gave the MTA’s plans for combatting traffic congestion a good review.
“I would give us a passing grade, just passing--a B-minus,” he said at a news conference in Studio City where he unveiled the updated action plan. “Hopefully, next year when we come back we will have a B or B-plus.”
Also attending the conference was Los Angeles City Councilman Richard Alatorre, chairman of the new MTA, formed by combining the Los Angeles County Transportation Commission with the Southern California Rapid Transit District. Alatorre said the MTA is attacking traffic gridlock by offering multiple transportation alternatives for commuters, including rail, car-pooling and buses.
“Obviously we are not going to take everybody out of cars and we don’t want to take everyone out of cars,” he said. “But we have to try to get a percentage.”
Most of the congestion remedies identified in the plan include previously-approved rail lines, car-pool lanes and expanded bus service.
The newest solution offered by transportation officials is a signal synchronization program that uses video cameras and computers to adjust traffic signals on a minute-by-minute basis, which city traffic planners say would speed motorists along 12% faster.
The $42-million program calls for replacing obsolete traffic signals and installing new computer hardware, pavement detectors and surveillance cameras linked to human signal controllers in downtown Los Angeles. The new traffic controls will be installed downtown, west Los Angeles and the San Fernando Valley.
The system, known as Automated Traffic Surveillance and Control, or ATSAC, was installed about three years ago on Ventura Boulevard between Valley Circle Boulevard in Calabasas and Cahuenga Pass, where it has significantly speeded the traffic flow, city officials say.
Funding for the system is provided by state gas taxes, federal grants and a city contribution. The California Transportation Commission last week approved its $23-million contribution to the signal synchronization program.
Other congestion relief programs suggested in the study include construction of car-pool lanes on surface streets. It also calls for restructuring bus service to better connect with business centers, new rail lines and express bus lines.
Another suggestion is to require local businesses and government agencies to develop traffic management strategies for major congested business centers in such areas as Hollywood and Santa Monica.
A rating of F(b) was given to more than 50% of the street intersections parallel to and crossing the San Bernardino and Pomona freeways, the Ventura Freeway from the western San Fernando Valley to downtown Los Angeles, the Hollywood and Golden State freeways, and the San Diego Freeway from Century Boulevard to Orange County.
The study also identified nine freeways that operate at level F(c):
* The Harbor Freeway from downtown Los Angeles to the Pacific Ocean. The average daily traffic volume is 298,000 vehicles in the downtown area and 238,000 in Inglewood.
* The San Diego Freeway from the San Fernando Valley to the Orange County line. The average daily traffic volume is 317,000 vehicles in west Los Angeles, 262,000 in Inglewood and 259,000 in Carson.
* The Foothill Freeway between the Ventura and Golden State freeways. The average daily volume is 233,000 in the San Fernando Valley and 190,000 at the San Gabriel Freeway.
* The Santa Ana Freeway from downtown Los Angeles to the Orange County line. The average daily volume is 200,000.
* The San Gabriel River Freeway from the Foothill to the Artesia freeways. The average daily traffic volume is 238,000.
* The Artesia Freeway from the Orange County line to the Long Beach Freeway. It has an average daily volume of 237,000 at the Long Beach Freeway and 272,000 at the San Gabriel Freeway.
* The Ventura Freeway. It has an average daily traffic volume of 280,000.
* The Hollywood Freeway. It has an average daily traffic volume of 201,000 in Glendale and 199,000 in Burbank.
* The Santa Monica Freeway. It has an average daily traffic volume of 341,000.
Freeway Nightmares The Metropolitan Transit Authority has singled out these freeway corridors as the most congestedin Los Angeles County.
Harbor Fwy. (110) from downtown Los Angeles to the Pacific Ocean. San Diego Fwy. (405) from the San Fernando Valley to Orange County. Foothill Fwy. (210) Santa Ana Fwy.(5) from downtown Los Angeeles to Orange County. San Gabriel River Fwy. (605) from 210 Fwy. to 91 Fwy. Artesia Fwy. (91) from Orange County to the Long Beach Fwy.(710) Ventura Fwy.(101 and 134). Hollywood Fwy. (101 portion). Santa Monica Fwy.(10).
More to Read
Sign up for Essential California
The most important California stories and recommendations in your inbox every morning.
You may occasionally receive promotional content from the Los Angeles Times.


