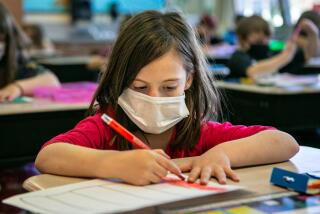
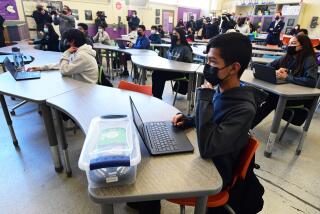
As O.C. campuses bring back students, here’s how schools in other countries are handling reopening
- Share via
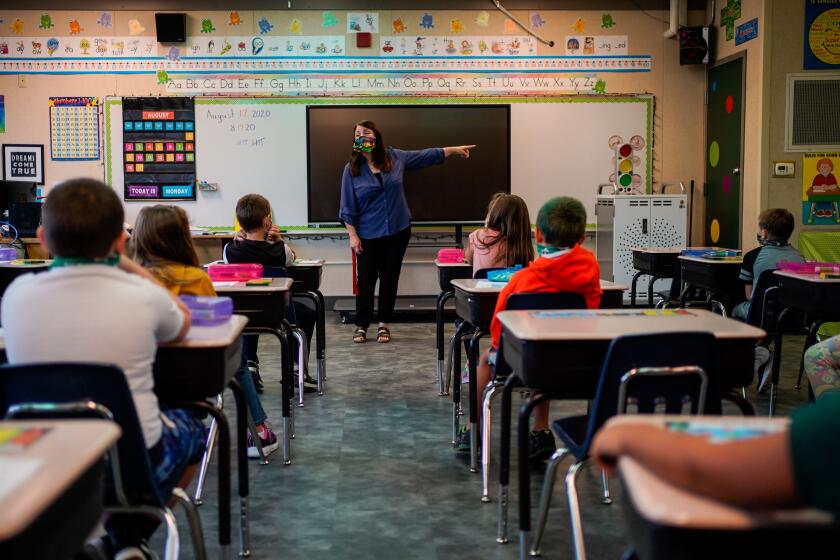
Schools in Orange County are beginning to reopen. For parents trying to gauge the safety of their school’s plan, it may be useful to put the county’s numbers and procedures in context with how places around the world have handled school reopenings.
Orange County got to this stage because new state guidelines announced at the end of August introduced colored tiers based on a county’s coronavirus cases.
Los Angeles County is still in purple, the worst tier, while Orange County is in red — which signifies substantial transmission. But if a county stays in the red tier for 14 consecutive days, it is allowed to reopen schools.
The red tier requires that COVID-19 infections per day per 100,000 people be from four to seven, as measured by the state, as well as a COVID-19 test positivity rate between 5% and 8%.
Orange County entered the red tier on Sept. 8 — it’s currently at 6.4 cases per day per 100,000 people and a 3.6% positivity rate.
For comparison, Los Angeles is at 7.7 cases per day per 100,000 (2.8% positivity rate); San Bernardino is at 6 (5.7%); Ventura is at 7.4 (3.8%); Riverside is at 5.8 (5.8%); and San Diego is at 6.8 (3.8%).
Ten out of 29 districts in Orange County have announced plans to reopen by the end of September. The Irvine Unified School District, along with schools in Tustin, Los Alamitos, Fountain Valley and Cypress, opened this week. In Irvine, a petition with more than 2,500 signatures is urging the district to remain online at the secondary school level.
in the last 6½ months, at least 277,285 schoolchildren in 38 states tested positive for the coronavirus, the CDC reported. Cases rose as school resumed.
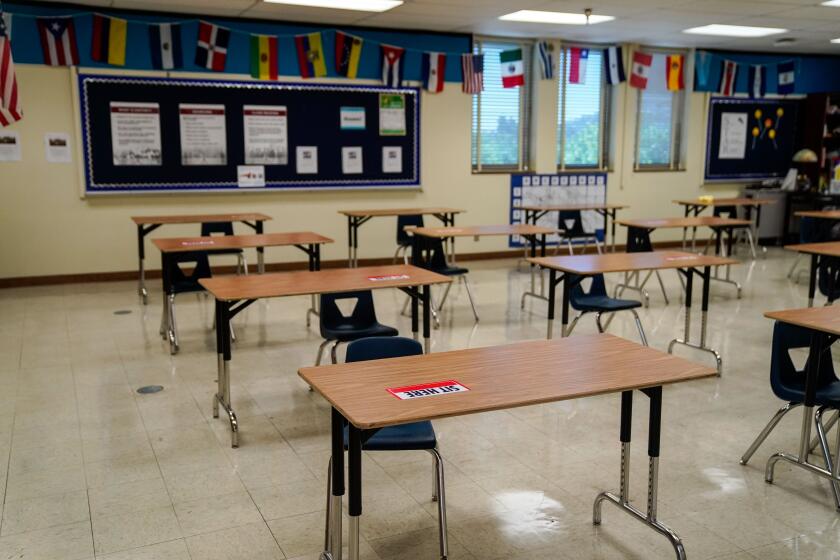
Experts say that the safety of school reopenings is partly about the measures that schools put in place — including masks or other shields, physical distancing guidelines, reduced class sizes, increased hygiene, routine screenings, contact tracing and protocol for when a coronavirus case is found.
Also important is how much the coronavirus is circulating in the community.
There is emerging data about how school openings have fared in the United States. Places such as Arizona, Florida, Georgia and Texas were recording test positivity rates between 10% and 25% when schools began opening in July and August, and some of the results are beginning to be seen.
Canadian schools opened in early September with inconsistent plans, resulting in multiple provinces reporting cases and hundreds of students and staff being asked to self-isolate.
But for the many countries around the world that opened months ago, there is clearer data.
In March, the U.N. Educational, Scientific and Cultural Organization formed the Global Education Coalition to respond to educational disruptions and manage effective recovery. Based on a survey of national responses to COVID-19 school closures, UNESCO released results on its first wave of data collection, which ended in June, and it is now collecting data for a second report.
UNESCO shared its report, “Responding to Covid-19 and Beyond: The Global Education Coalition in Action,” in a virtual U.N. general assembly Friday.
Here are some numbers, based on data from UNESCO, the University of Washington’s Department of Global Health, Our World in Data, and the Kaiser Family Foundation, as well as what’s been reported about countries’ strategies and results.
Here is how California’s new coronavirus reopening rules will impact you
Here are some details to consider:
- According to Centers for Disease Control and Prevention numbers updated this week, children 4 years old and younger account for 87,897 (1.5%) of the total confirmed cases in the U.S., and those ages 5 to 17 account for 327,069 (6.6%). But children in the U.S. have also been less likely to be tested as they’re less likely to be symptomatic. Combined, the groups account for less than 0.1% of U.S. deaths at 89 total.
- One of the key international numbers compiled by the University of Washington and the Kaiser Family Foundation accounts for a seven-day average of cases per million people, which is different from California’s measurement of new positive cases per day per 100,000. (For example, California shows Orange County at 6.4 COVID-19 positive cases per day per 100,000 people, while the seven-day average per 100,000 in the county is 5.7.) The numbers below have been adjusted to show the seven-day average of COVID cases per 100,000 for ease of comparison.
- Positivity rates vary depending on a country’s testing strategy, including the ability to trace and isolate potentially infected people. The U.S. strategy until recently had been to test only those with symptoms.
- Countries listed below were chosen based on availability of data.
Here are the details for Orange County:
Shutdown: March 17
School reopenings begin: Sept. 24
Daily cases: 165
Daily cases per 100,000 (seven-day average): 5.7
Test positivity rate: 3.6%
School reopening strategy: In general, school districts that are opening are offering parents a choice among 100% in-person instruction, 100% distance learning or a hybrid to try to limit the number of students in the classroom. Anaheim and Santa Ana school districts are not reopening due to their higher case numbers. Check with your individual school districts for details on their reopening plans.
So how does Orange County compare?
Less than 1 average daily case per 100,000 over seven days
Taiwan
Shutdown: Winter break extended two weeks
School reopening: Feb. 25
Daily cases: 1.1
Daily cases per 100,000 (seven-day average): 0
Test positivity rate: 0.2%
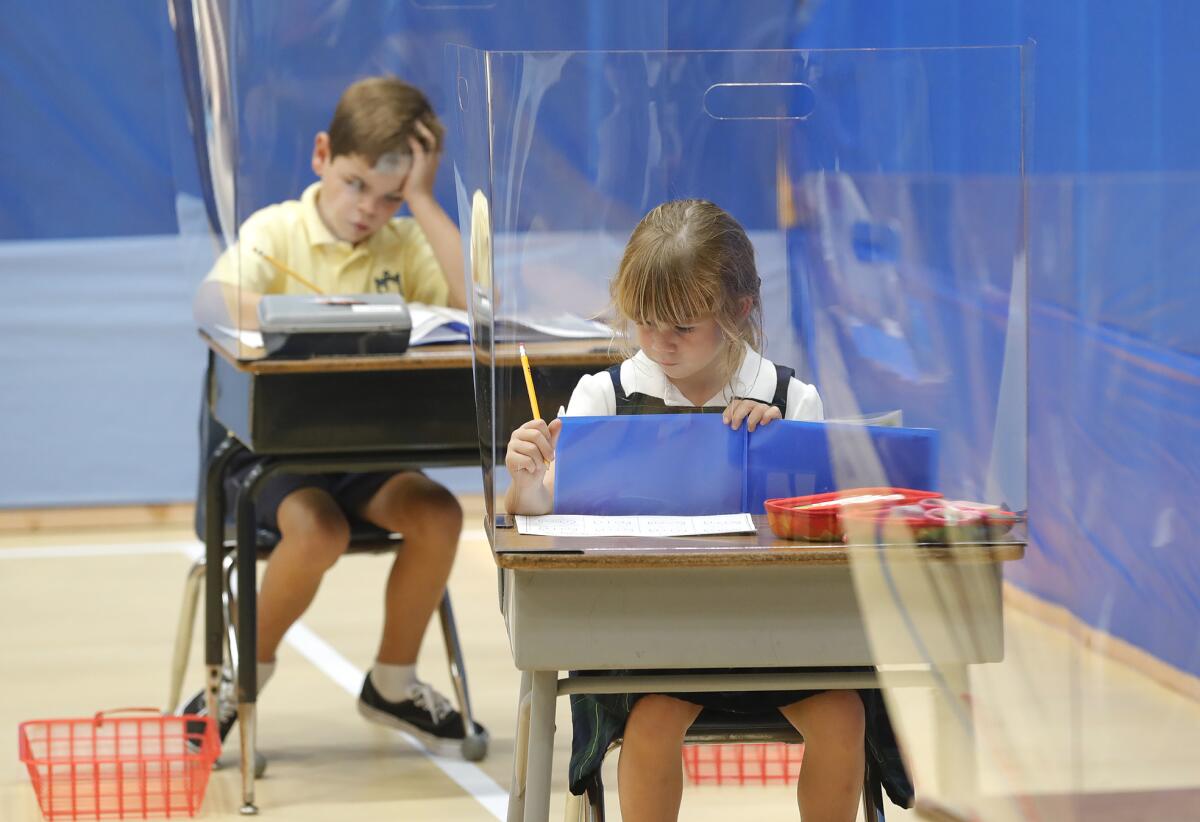
School reopening strategy: Masks and physical distancing required. Desks had plastic dividers whenever possible, especially when eating. Twice-a-day temperature checks. Handwashing required before entering classrooms. Shoes sanitized. Schools cleaned daily. Strict quarantine rules.
What happened: No outbreaks linked to schools.
Japan
Shutdown: March 2
School reopening: April 24
Daily cases: 439
Daily cases per 100,000 (seven-day average): 0.35
Positivity rate: 8.7%
School reopening strategy: In general, Japanese schools reopened with staggered attendance to avoid overcrowding, with required masks, physical distancing and daily temperature checks. Some schools had vinyl shields for each student’s desk. In August, a petition from scholars and researchers urged class sizes to be reduced to 20, but Japan’s Riken research institute argued that large classes can be held safely as long as ventilation is sufficient.
What happened: The education ministry reported a total of 84 elementary, junior or senior high schools closed temporarily in June and July. But while there have been reported coronavirus cases, they haven’t yet been linked to wider spread in schools.
Switzerland
Shutdown: March 16
School reopening date: May 11
Daily cases: 57.1
Daily cases per 100,000 (seven-day average): 0.07
Positivity rate: 1.3%
School reopening strategy: Many schools reduced class sizes by 50% and had in-person classes only two days a week. Masks were not required, and there were no temperature checks, though handwashing stations were added throughout the schools. School reopening for students in grade 10 and higher was delayed until June 8, and later there were mask orders for older students.
What happened: Despite the fact that shops, restaurants, museums and libraries all opened on the same day, there was a drop in case counts after the reopenings. The cases crept up in July after schools were out. A new study of schools in Zurich questions whether most infections are undiagnosed.
New Zealand
Shutdown: March 24
School reopening date: May 14
Daily cases: 1.1
Daily cases per 100,000 (seven-day average): 0
Positivity rate: 0.2%
School reopening strategy: There were physical distancing measures, including a “kiss and go” zone where parents could drop off children. No mask requirements or temperature checks, but a flu-tracking survey that asks if students have had a fever or cough is used; this also helps track COVID-19. Parents were also allowed to delay their kids’ return to school if they felt uncomfortable.
What happened: No outbreaks linked to schools.
Vietnam
Shutdown: Feb. 28 to March 31
School reopening date: May 18
Daily cases: 4.6
Daily cases per 100,000 (seven-day average): 0
Positivity rate: 0%
School reopening strategy: Masks were required, and adults and students got temperature checks before entering school buildings. One challenge was that 30% of schools in Vietnam don’t have access to running water or soap, so the Ministry of Education worked with UNICEF to highlight the need to bring safe hygiene and sanitation measures to schools.
What happened: No new outbreaks linked to schools.
Greece
Shutdown: March 11
School reopening date: June 1
Daily cases: 5.6
Daily cases per 100,000 (seven-day average): 0.05
Positivity rate: 0.1%
School reopening strategy: Class size reduced to a maximum of 15, with students often attending on different days. Breaks were staggered, and there were physical distancing requirements.
What happened: It’s unclear how school reopenings affected case numbers, as Greece’s tourism opened up soon after schools on June 15. Cases went up over the summer, with late August bringing the highest daily totals since the coronavirus emerged in Greece in February. The fall reopening of schools was delayed a week in September, amid safety concerns.
South Korea
Shutdown: March 2
School reopening date: June 8
Daily cases: 44.4
Daily cases per 100,000 (seven-day average): 0.09
Positivity rate: 0.3%
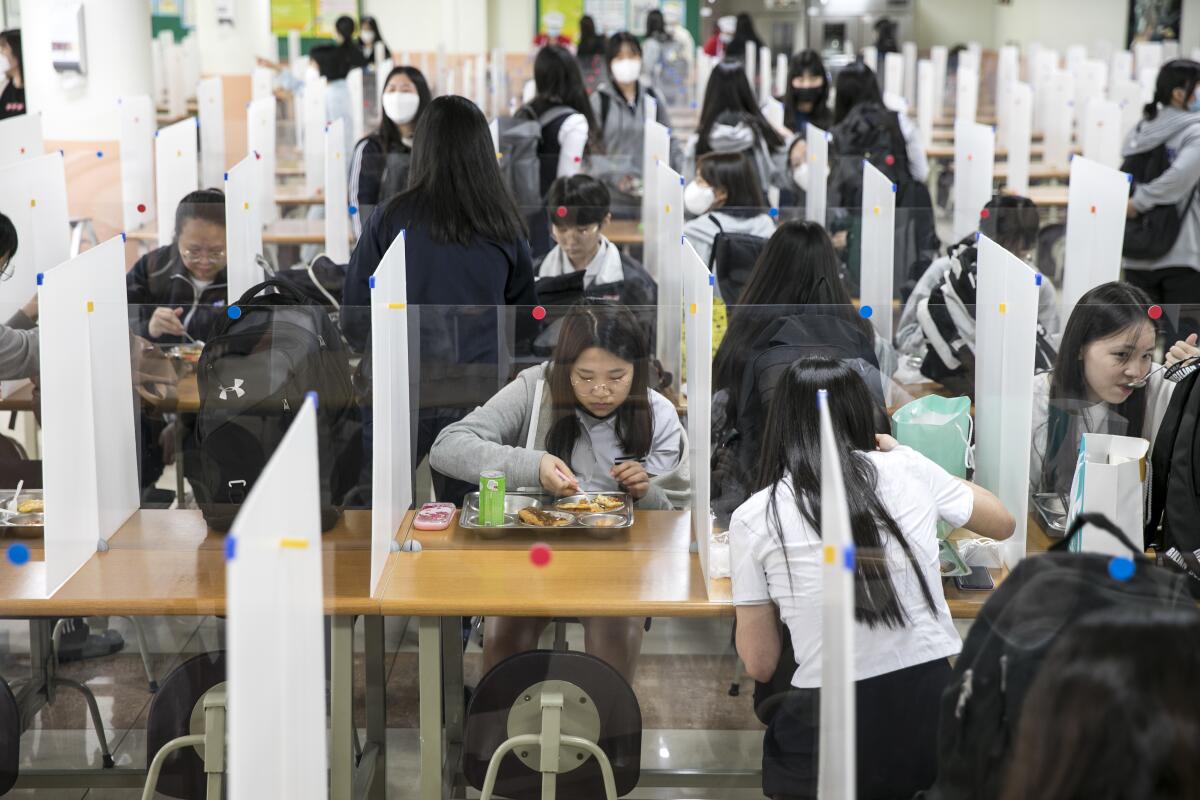
School reopening strategy: South Korea’s first attempt to reopen schools was in May, but the government closed them down days later because of a spike in cases. In June, they started with high school students and gradually opened to younger students. There was contact tracing and physical distancing, required masks, as well as increased handwashing and temperature checks. Classroom sizes were reduced one-third or two-thirds through alternative shifts, and plastic barriers were placed on desks in the front of the room to protect teachers. There were also plastic barriers to separate students during lunch time when masks were off.
What happened: Since opening, in-person school has been off and on, depending on the coronavirus rates. In late August, schools in the greater Seoul area were closed again after nearly 200 staff and students were infected, but they returned Sept. 21 after cases declined. In general, overall rises in cases in South Korea have been tied to a club, a church and a rally — not schools.
1 to 2 average daily cases per 100,000 over seven days
Norway
Shutdown: March 11
School reopening date: April 20
Daily cases: 93.3
Daily cases per 100,000 (seven-day average): 1.72
Positivity rate: 3.8%
School reopening strategy: Norway started with younger students only. In May, they operated under a traffic light model, in which some schools in the green zone were able to run during normal hours, and red schools adopted alternating shifts and limited class sizes to 15. No masks or temperature checks were required, but they implemented physical distancing rules and increased handwashing. By June, everyone was in “yellow,” which requires physical distancing and hygiene measures.
What happened: In May, a senior official from the Norwegian Institute of Public Health cautiously shared that they hadn’t seen any negative effects in terms of infection spread after the school reopenings. Coronavirus cases continued to decline in Norway in the following months, and only recently have cases gone up, a rise linked to young adults, not schools.
Israel
Shutdown: March 12
School reopening date: May 3
Daily cases: 126.7
Daily cases per 100,000 (seven-day average): 1.46
Positivity rate: 1.4%
School reopening strategy: Masks were required for fourth-grade and above; those over age 7 had to wear masks outside the classroom. Initially, Israel reduced class sizes, but went to normal a few weeks later. No temperature checks or physical distancing requirements, but close contacts of everyone infected were traced and quarantined.
What happened: There were many outbreaks, and 355 of 5,000 schools temporarily closed by mid-June. Israel opened restaurants, bars and tourism at the same time as schools. Though they had mostly contained the virus, these simultaneous reopenings are credited with kickstarting Israel’s second wave.
Germany
Shutdown: March 3 to 18
School reopening date: May 4
Daily cases: 1,140.3
Daily cases per 100,000 (seven-day average): 1.36
Positivity rate: 2.4%
School reopening strategy: Germany started with older students, thinking that secondary school students would be better able to adhere to the mask and physical distancing requirements. They had a hybrid model, with in-person and online school, alternating shifts, and a maximum class size of 10. German schools were big on testing: Some schools tested every four days. Masks were required in hallways, but not inside classrooms for those who tested negative.
What happened: When they first opened, 42 out of 825 schools in Berlin reported COVID-19 cases. In general, there was increased transmission among students but not staff, and schools didn’t necessarily close when there were positive cases. Proportions of new infections in those under 19 doubled from May to June, but that could be attributed to wider testing. Overall, there haven’t been major outbreaks linked to schools.
France
Shutdown: March 3 through 16
School reopening: May 11
Daily cases: 1,110.9
Daily cases per 100,000 (seven-day average): 1.7
Positivity rate: 1.1%
School reopening strategy: Masks were required in secondary schools, and class sizes were reduced to 15.
What happened: Days after reopening, 22 schools were shut down. Education Minister Jean-Michel Blanquer told the media that the reopenings had put some children in danger because many were infected before school had started. By late June, a return to in-person school was required, but it only lasted a few weeks before the summer holiday. A summer surge in cases led to some concern over mandatory in-person classes in the fall, but a recent survey showed that 79% of parents were in favor of sending their children back to in-person school.
The new school year of remote learning will bring unique challenges. Here are guides to help parents of school-age children navigate remote learning, as well as recent updates about education in Southern California.
An average of over 2 daily cases per 100,000 over seven days
Sweden
Shutdown: No overall shutdown. High schools and colleges closed temporarily, but day care centers and elementary schools have remained open.
Cases: Sweden’s cases have been relatively low compared with neighboring countries (numbers rose to approximately 5 daily cases per 100,000 [seven-day average] in the spring; hit the peak in the summer at around 10 before going under 2; but are now rising again — currently at 3.25. The government is considering new restrictions.
School reopening strategy: No major adjustments.
What happened: Swedish privacy laws allow healthcare personnel and school officials to notify parents and school staff about an infection only “if a person’s life is at risk.” Because of that, there is relatively little data, though by May, there were at least three reported deaths among teachers and staff, as well as school closures because of staff infections (children were not tested). According to the University of Washington report, the Swedish Public Health Agency found that the antibody prevalence in school-age youth was 4.7%, compared with 6.7% in adults and 2.7% in the elderly. The relatively high rate in children suggests there may have been significant spread in schools.
Denmark
Shutdown: March 16
School reopening date: April 15
Daily cases: 205.7
Daily cases per 100,000 (seven-day average): 3.55
Positivity rate: 6.2%
School reopening strategy: Denmark was the first country in Europe to shut down and the first to reopen schools. They started with younger students only, in a maximum class size of 12. They were assigned to small cohorts that physically distanced from other cohorts, but kids within the cohorts didn’t have to distance from each other. There was an effort to teach classes outside; for example, in parks. No mask requirement or temperature checks, but there was increased handwashing, reportedly as much as every hour. (This was relaxed when students started developing eczema.)
What happened: There was no significant increase in cases. In fact, numbers continued to decline after school reopenings. Middle and high schools opened in May. Social distancing rules were eliminated by August.
Belgium
Shutdown: March 13
School reopening date: May 18
Daily cases: 291.3
Daily cases per 100,000 (seven-day average): 2.51
Positivity rate: 2.1%
School reopening strategy: Belgium started with younger students, with alternate days and a maximum class size of 10. Teachers were required to wear masks, but not the students. Some classes met in churches to better physically distance in large spaces.
What happened: Officials have said there is no evidence of increased spread after the school reopenings.
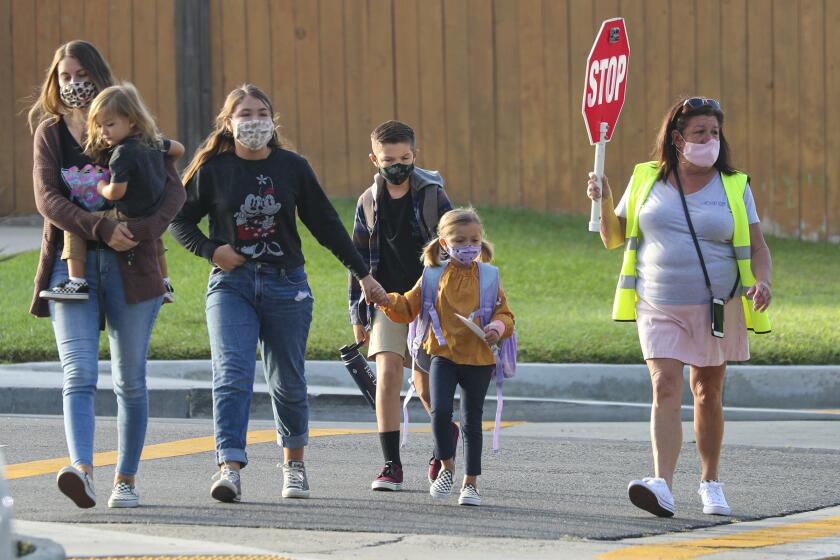
About 200,000 Orange County students are back to school amid celebrations and safety concerns, a major test of school districts’ ability to reopen campuses amid the COVID-19 pandemic.
More to Read
Get the Latinx Files newsletter
Stories that capture the multitudes within the American Latinx community.
You may occasionally receive promotional content from the Los Angeles Times.
