San Francisco Bay Area’s COVID death rate was among the lowest in the nation. Here’s why

- Share via
The San Francisco Bay Area fared better during the COVID-19 pandemic than many other largely populated areas, with a cumulative COVID-19 death rate among the lowest of the nation’s most populous counties, according to a Los Angeles Times analysis.
Of the nation’s 88 counties with a population greater than 750,000 people, San Francisco and neighboring Santa Clara, Alameda, Contra Costa and San Mateo counties had COVID death rates among the lowest in the country.
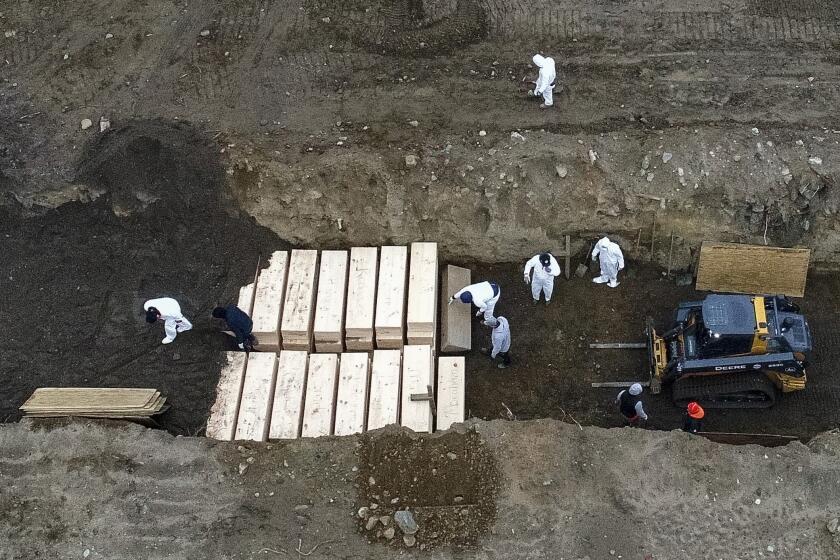
The nine-county region of the Bay Area reported 10,093 COVID-19 deaths through March, as tallied by Johns Hopkins University before it ended its comprehensive count. That translates to a cumulative rate of 130 deaths for every 100,000 residents. That’s 37% of Los Angeles County’s death rate of 354 deaths per 100,000 residents (the 27th-highest cumulative rate) and one-quarter of New York City’s cumulative rate of 540 deaths for every 100,000 residents.
Each of New York City’s five boroughs is technically its own county. If New York City were considered to be a single county, it would have the worst COVID-19 death rate among the nation’s counties with more than 750,000 residents.
With the emergency phase of COVID-19 over, a Los Angeles Times analysis shows how the pandemic took different tolls on L.A. County and New York City.
Other highly populated counties with death rates comparable to the Bay Area’s include Honolulu County in Hawaii and Wake County in North Carolina, which is home to Raleigh, the state capital.
Even when the COVID death rates are adjusted for differences in the age distribution of the population, San Francisco and Santa Clara County — Northern California’s most populous county — still had a relatively low rate compared with the country’s two largest metropolitan areas.
A Times analysis, calculated from data released by local health officials and adjusted for age, shows San Francisco had one-third the death rate of L.A. County and roughly one-fourth that of New York City’s. Santa Clara County had an age-adjusted death rate about 40% of L.A. County’s and roughly 30% of New York City’s.
Some experts caution against comparing jurisdictions, given the wide differences in the structures of metropolitan areas. New York City was arguably quite vulnerable because of its population density — the number of people living per square mile — and possibly the way people’s lives are structured there, which may have allowed the coronavirus to spread unchecked before stay-at-home orders went into effect.
In addition, the colder weather in New York City could’ve contributed to the rapid spread of the virus in indoor public settings.
In order to move through a world where the coronavirus is endemic, we need a reliable way to assess our individual level of immunity. Here’s how we can.
Los Angeles County had its own vulnerabilities, with more overcrowded homes than any other large U.S. county, a Times analysis published last year found. Many people could not work from home and became infected in crowded workplace settings such as factories.
By contrast, the Bay Area probably had some advantages, including the ability of many to work from home. The region’s poverty rate is also lower than L.A.’s: The San Jose-Sunnyvale-Santa Clara metro area has 7.3% of residents living below the poverty line, and the San Francisco-Oakland-Berkeley metro area has 9.2% living below the poverty line. In Los Angeles County, 13.9% live below the poverty line, and in New York City, 18.3% do.
Scientists can compare jurisdictions in other ways, including assessing the differences in “all-cause excess mortality” — the number of deaths from all causes that are above what would be expected if there weren’t a pandemic. This would include COVID-19 deaths plus those not directly caused by COVID, such as chronic health problems that worsened during the pandemic.
Amid controversies over stay-at-home and masking orders, a lasting difference between Govs. Gavin Newsom and Ron DeSantis’ approach may end up being rhetoric on vaccine safety.
In a report published in the journal Public Health Reports, officials with the San Francisco Department of Public Health, along with co-authors from UC San Francisco and UC Berkeley, calculated the excess all-cause mortality rate in San Francisco in 2020, as well as statewide.
They found that San Francisco’s excess mortality rate was half the state’s total. In 2020, there was an 8% increase in deaths from all causes in San Francisco compared with the prior year. By contrast, across all of California, there was a 16% increase.
In that report, the authors touted policies issued early in the pandemic they say helped lower COVID’s impact on San Francisco, including the nation’s first regional stay-at-home order, an action epidemiologists said that, because it was implemented early, probably helped dramatically slow transmission of the coronavirus.
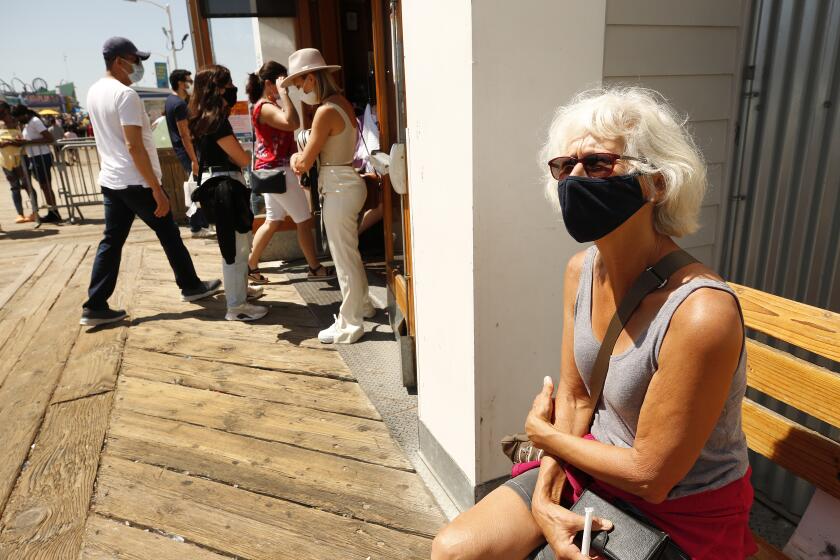
They also noted the region’s long-lasting mask mandate, which was in place for nearly two years, save for a brief gap before the Delta variant emerged in California in summer 2021.
Some San Francisco Bay Area counties are reinstituting mask requirements in healthcare settings to coincide with arrival of the annual respiratory illness season.
Importantly, Bay Area residents seemed to be largely agreeable with the health orders. Adherence to mask use, for instance, appeared to be quite high compared with other parts of the state and country.
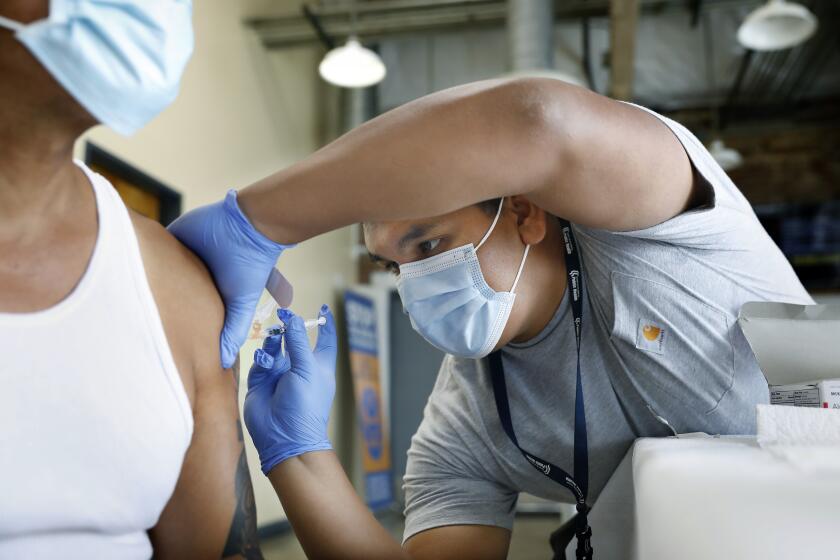
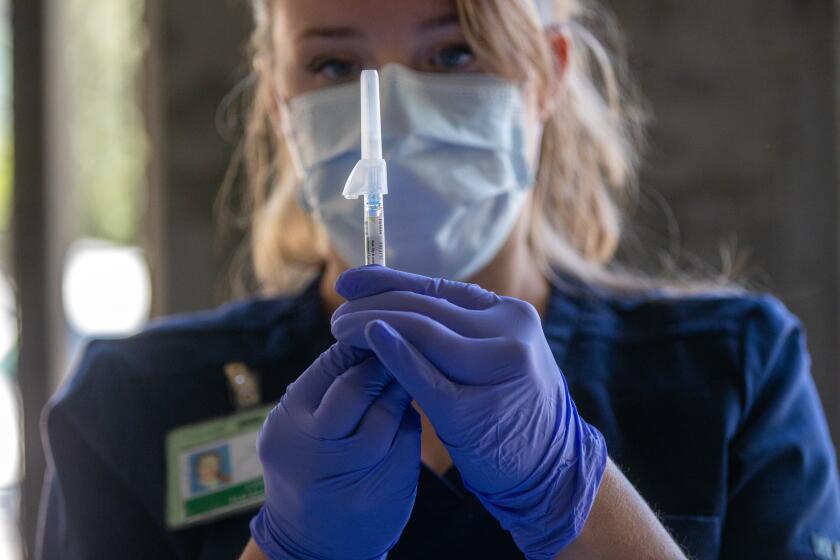
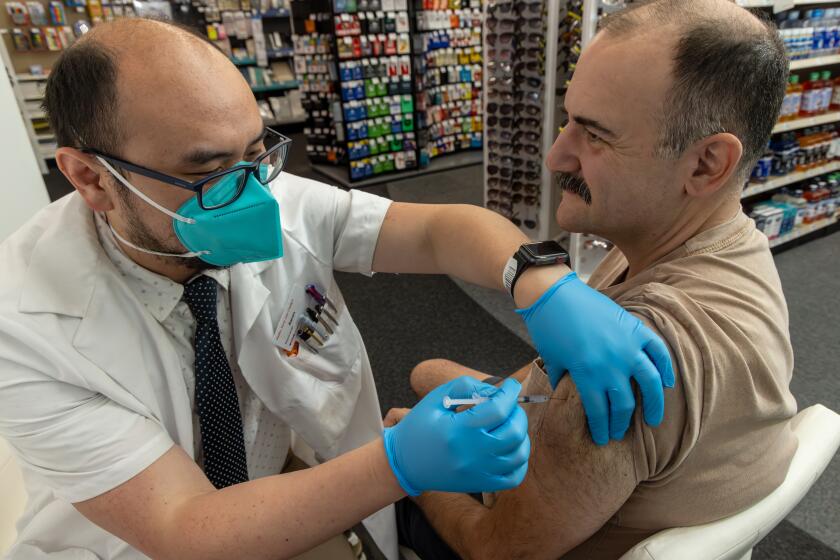
Vaccination rates were also high in the region. By the end of the national pandemic emergency on May 10, 96% of seniors in the Bay Area had completed their primary vaccination series, compared with 89% of Los Angeles County seniors and 91% of New York City seniors.
With each iteration of new booster shots, the Bay Area widened its relative lead among seniors. With the first round of boosters, given in late 2021, 86% of Bay Area seniors got one, compared with 75% in L.A. County and 60% in New York City.
And for the first updated booster shot, made available in September 2022, 63% of the Bay Area’s seniors got one, compared with 46% of seniors in L.A. County and 32% in New York City.
More to Read
Sign up for Essential California
The most important California stories and recommendations in your inbox every morning.
You may occasionally receive promotional content from the Los Angeles Times.
