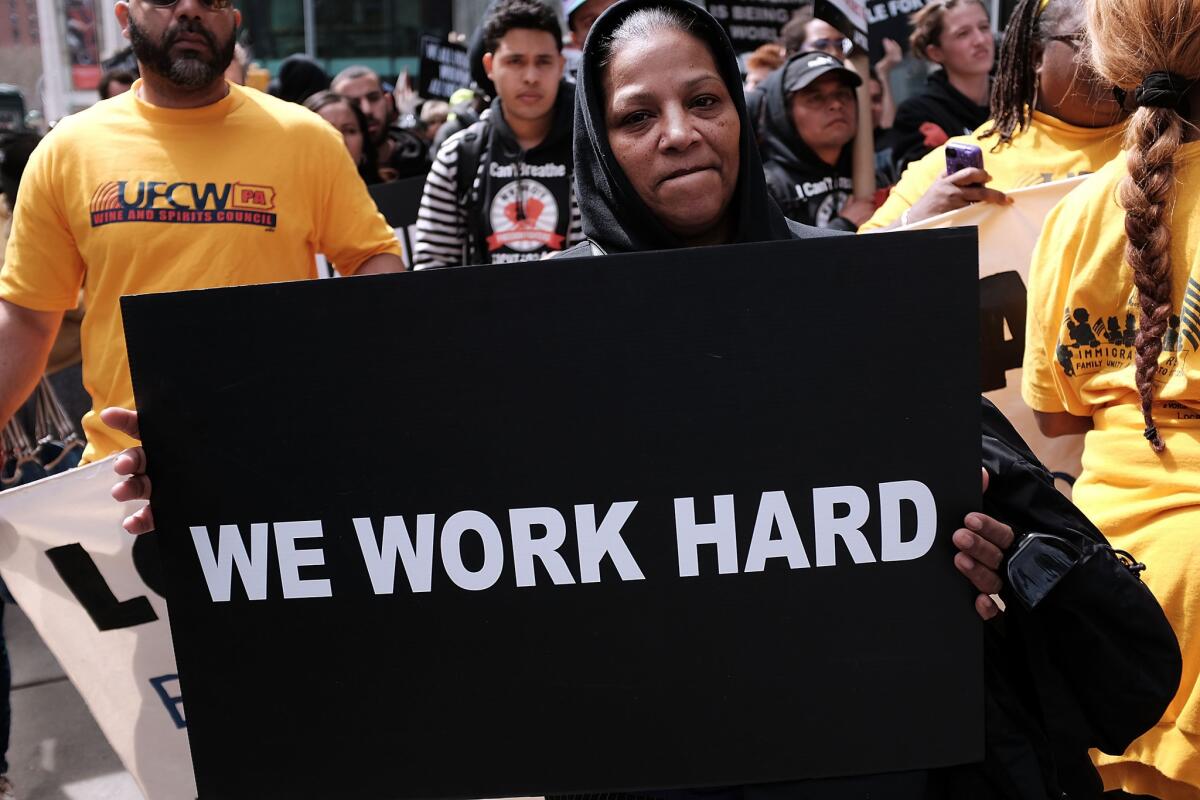
Opinion: The country — especially California — has a major poverty problem

- Share via
To the editor: The Times’ article on the Census Bureau report on income levels was informative but misleading in regard to the percentage of people living in poverty, especially in California. (“American households finally earn more than they did in 1999,” Sept. 12)
The article did not use or report on the Census Bureau’s Supplemental Poverty Measure, which factors in the cost of living (such as the price of housing) and is generally considered a much more accurate measure of people’s financial situation. That is especially important in California.
Under that official measure, 20.4% of Californians live in poverty, the highest percentage of any state in the country. That percentage also is virtually unchanged since 2013. Nationwide, 14.7% of people live in poverty under this measure.
Reporting on the more accurate Supplemental Poverty Measure is crucial because the lack of public awareness about the human and fiscal crisis of poverty in California is a major reason that comprehensive, sustained actions have not been taken to reduce it.
Conway Collis, Pasadena
The writer is a member of the First 5 California Commission and president and chief executive of the anti-poverty group GRACE.
..
To the editor: The median income chart shown was misleading. The chart was for median income for all households.
As the baby boomers have aged, the median age has gone up, so the current median worker is older and has more experience. I think a better comparison is for a specific age range, for instance individuals 35 to 44 years old.
The data show that income peaked in 1973 at about $58,000 and was about $51,000 in 2016 (all numbers are in 2016 dollars), so according to this “apples to apples” comparison, the median worker is worse off now than in 1973. It’s even worse than that if you take into account the loss of benefits such as pensions and retiree medical insurance.
Your chart also begins at 1967 even though the census data go back to 1947. The missing data show a huge increase in median income, from about $27,000 in 1947 to $58,000 in 1973. During that time period, taxes were high, unions were strong and regulations were enforced. It was the era of big government.
Strangely, it was the exact opposite of the low-tax, small-government idea that Republicans are peddling.
Jeff Christie, Woodland Hills
Follow the Opinion section on Twitter @latimesopinion and Facebook
More to Read
A cure for the common opinion
Get thought-provoking perspectives with our weekly newsletter.
You may occasionally receive promotional content from the Los Angeles Times.


