How a group of scientists are using the deadly Montecito mudflow to predict future disasters
- Share via
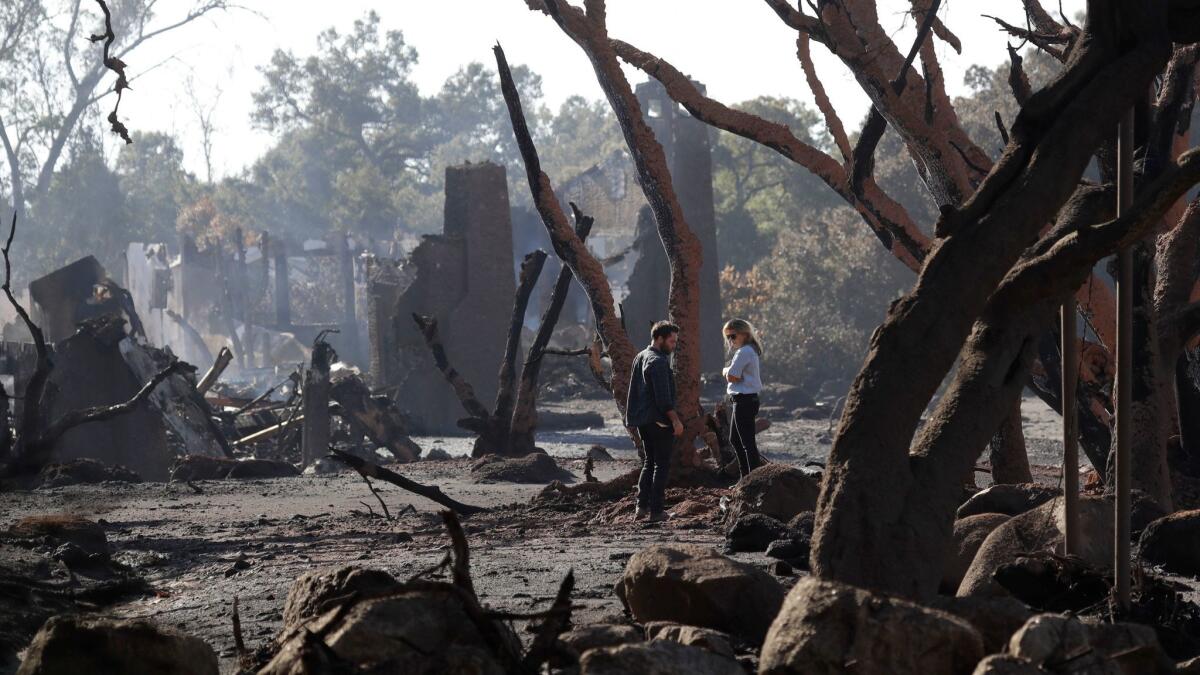
A wall of sandstone boulders, some the size of RVs, barreled through Montecito, followed by a growing tail of water, mud and debris.
On its way to the ocean, the mudflow’s momentum shifted as it choked local creeks and slammed into curbs, walls and buildings.
Attempting to make sense of the flow’s path, which left more than 20 people dead and destroyed scores of homes Jan. 9, scientists surveyed the area days after the slide. They noted that a predicted rainstorm’s unexpected ferocity combined with the community’s unusual geological makeup to maximize devastation.
The work of the researchers is part of a larger effort to better understand what was the deadliest flooding event in California in several decades. The death toll has sparked questions about why the mudslides were so intense and whether more could have been done to get people out of harm’s way before the mud and debris inundated homes.
Santa Barbara County released conflicting evacuation instructions that left the hardest-hit neighborhoods out of mandatory evacuation zones. It did not send out Amber Alert-style bulletins to cellphones until the mudslides had begun. By then, it was too late for residents to flee.
On Thursday, Sheriff Bill Brown announced changes aimed at better preparing residents for fires and floods.
“Was what we did sufficient on January the 8th? … Obviously, in retrospect, it was not,” Brown said.
Beyond better preparations and evacuation plans, scientists believe there are lessons in the flow of the mud.
Unlike other communities singed by fire and then visited by rain, the hills above Montecito are almost exclusively made up of large rocks or fine, sandy dirt without much in between, said U.S. Geological Survey research hydrologist Jason Kean.
So when a once-in-200-year storm cell dropped half an inch of rain in five minutes early that morning, it created what Kean called “a moving dam.” The largest parts of the mudflow — the boulders — naturally rolled to the front, creating a wall that let the river behind it grow in height and force instead of dispersing its energy wider across the landscape.
“It had really big tools to do destruction and a lot of fine-grain material to keep them mobile,” Kean said. “It’s definitely bad.”
When the storm and mudflow subsided, the destruction was worse than anyone had predicted. That’s something that Kean and his colleagues at the USGS, California Geological Survey, California Department of Forestry and Fire Protection, and Santa Barbara County Fire Department want to change. Current USGS maps show only which hillsides are prone to debris flows, but not where those flows will go.
Should something like this happen again — a very real possibility for at least the next five years in areas below the Thomas fire burn area — scientists want to be able to accurately predict debris flows’ paths.
“Though a lot of sediment has been evacuated, there’s still a lot there,” Kean said. “It’s tough for residents to hear, but there’s plenty of ammunition left there.”
After measuring everything they can about the debris flow, scientists will attempt to recreate the event using computer models. They will use the speed of the flow, its geological makeup, boulder size and the trajectories that occurred when it hit natural and artificial barriers such as hills and houses.
“It’s tricky,” Kean said. “It’s computationally more demanding to model flows downstream. … A small thing like topography can really change where the flow goes.”
But if scientists can successfully create formulas to map out what happened in Montecito, or something close to it, emergency planners can better inform their communities of the risks they face before a storm.
Authorities in Montecito were criticized after last month’s storm for limiting mandatory evacuations to an east-west zone above the town’s main highway, even though the area’s creeks run north-south.

Officials said the storm they planned for was not the storm they received. A map of potential debris flows showing what could happen in 100- or 500-year storms was provided by a private company before the Jan. 9 storm and proved remarkably accurate. Kean said a USGS model would offer additional scenarios.
The model could show different scales of a potential disaster zone, depending not only on the level of rainfall, but on what stands in the path of a debris flow. The group plans to compare what was in place in Montecito with Carpinteria, where a mudflow also occurred but was successfully contained in large catch basins.
“One thing we learned from this event is that structures, especially bridges and culverts, played a big role in determining where the flows went,” Kean said. “Our hope is to have maps that show the broad-scale potential for inundation and reasonably reflect where the flow could be substantially diverted by man-made structures or natural/constructed topography.”
Kean said Southern California offers the best locations to model potential disaster zones because of its high frequency of fires followed by rain, the region’s steep terrain and dense population centers.
“It’s the most acute here,” he said. “That said, the problems exist beyond. … More people are asking for our help.”
The study results should be published later this year.
For breaking California news, follow @JosephSerna on Twitter.
UPDATES:
7:35 a.m., Feb. 9: This article was updated with a comment from Sheriff Bill Brown.
This article was originally published at 11:18 a.m. on Feb. 7.
More to Read
Sign up for Essential California
The most important California stories and recommendations in your inbox every morning.
You may occasionally receive promotional content from the Los Angeles Times.


