Making Streets Safer : Controlling Traffic With New Technology
- Share via
Traffic collisions, including those that involve serious injuries, have dropped in the San Fernando Valley so far this year.
But speeding is still the No. 1 cause of collisions and fatalities. The Los Angeles Police Department and the city Department of Transportation use a variety of means to help keep traffic moving while making streets safe.
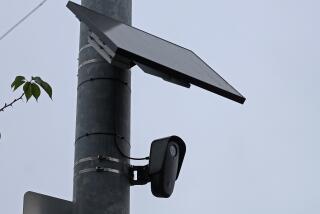
The revolutionary Automated Traffic Surveillance and Control system is supposed to do just that. Already in place at 2,000 of the city’s 4,000 intersections, the system depends on cameras, traffic-detecting electronic devices embedded in the pavement and a central computer to monitor traffic.
Temporary measures such as speeding checkpoints and increased traffic citations have been used in the Valley. Although these measures may cause a decrease in collisions, they aren’t permanent solutions. For instance, checkpoints were set up along notably dangerous corridors in the Valley last spring after a string of fatal collisions. Collisions decreased, but only temporarily.
Each year, the transportation department examines high-accident locations. To cut down on collisions at dangerous intersections, traffic-signal timing may be adjusted, a left-turn light added or speed limits changed.
Keeping an Eye on Traffic
The $300-million automated traffic system uses video cameras and sensors embedded in pavement to relay up-to-the-minute traffic data to a nerve center beneath City Hall. The transportation department’s goal is to eventually install detectors in the pavement at each of the city’s 4,000 intersections.
In the Valley, the automated traffic system is in place at all signals on Ventura Boulevard within city limits and at all signals between Victory and Ventura boulevards, from Valley Circle to Cahuenga Boulevard.
Components of the System
A - Sensors embedded in roadways register the traffic count
B - Signals are relayed to city traffic computers Downtown
C - Timing of traffic signals and ramp meters can be changed to ease congestion
D - Closed-circuit television cameras are located at major street crossings (18-20 in the Valley)
E - Changeable message signs on city streets
Valley Accidents
There were 15.6% fewer fatal collisions for the first eight months of 1995 compared to the same period last year. Accidents involving serious injury decreased only slightly for the same period.
Fatal Collisions
(By police division, as of Aug. 31)
*--*
1994 1995 Van Nuys 14 10 West Valley 12 24 North Hollywood 17 3 Foothill 11 8 Devonshire 10 9 Valley total 64 54
*--*
Serious Injury Collisions
(By police division, as of Aug. 31)
*--*
1994 1995 Van Nuys 74 79 West Valley 95 74 North Hollywood 64 58 Foothill 72 73 Devonshire 58 77 Valley total 363 361
*--*
Fatal Traffic Collisions With Pedestrians in the Valley
Here is a sampling of the 18 collisions involving pedestrians, as of Sept. 24:
* 9 involved jaywalking
* 3 involved victims under 17
* 4 involved seniors
* 3 involved collisions with pedestrians in legal crosswalks
* 1 collision on private property
Top Collision Causes
* Speeding
* Not heeding right of way
* Left turns
* Pedestrian in roadway
Sources: Los Angeles Police Department; Los Angeles Department of Transportation; California Highway Patrol; Caltrans
Researched by STEPHANIE STASSEL and JULIE SHEER / Los Angeles Times
More to Read
Sign up for Essential California
The most important California stories and recommendations in your inbox every morning.
You may occasionally receive promotional content from the Los Angeles Times.


