Inland Empire Traffic Is 5th Worst
- Share via
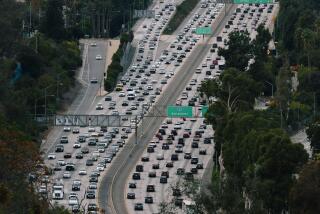
A massive migration of families in search of housing, plus an onslaught of truck traffic from local ports, has pushed the fast-growing Inland Empire onto a list of the nation’s top five most traffic-choked urban areas, transportation experts said Tuesday.
Though the Los Angeles area -- which includes portions of Ventura and Orange counties -- still has the country’s worst traffic, motorists in the Inland Empire who travel during rush hour have endured more than a 500% increase in the amount the time spent stuck in traffic: from nine hours in 1982 to 57 hours per year on average in 2002, according to a study released Tuesday by the Texas Transportation Institute.
For the record:
12:00 a.m. Sept. 9, 2004 For The Record
Los Angeles Times Thursday September 09, 2004 Home Edition Main News Part A Page 2 National Desk 1 inches; 44 words Type of Material: Correction
Traffic congestion -- An article in Wednesday’s California section about the rankings of urban areas with traffic problems said the Texas Transportation Institute ranked the Inland Empire as the fifth worst in the nation. The institute revised its figures and now ranks it seventh.
The increase ties the Inland Empire with Dallas-Fort Worth for the biggest increase in traffic over 20 years. It also propels the region from 32nd place in the institute’s 1982 ranking to fifth place in 2002, leapfrogging over such high-density hubs as San Jose, Chicago and Orlando.
The Bay Area came in second in the rankings, with an increase of nearly 22% in traffic delays over the past decade.
The institute, which is affiliated with Texas A&M; University and is known for producing accurate traffic analyses, compares actual commute times with the time those trips would take in free-flowing traffic.
The increasing congestion in the Inland Empire was no surprise to regional transportation officials, who cited as a reason the migration of people from Los Angeles and Orange counties to San Bernardino and Riverside counties in search of affordable homes.
The population in those inland counties jumped by 660,000 residents from 1990 to 2000 -- a 25% increase -- and was expected to grow 74% more by 2025, according to census figures and regional government planners. The two counties were home to 14 of the region’s 20 fastest-growing cities or unincorporated areas during the 10-year period.
But the job centers have remained primarily in Los Angeles and Orange counties, creating a growing number of long-distance commuters.
“They still continue to go to work where their jobs originally were,” said Ron Roberts, former head of the Riverside County Transportation Commission.
Contributing to the freeway morass is an increase of trucks that haul cargo from the ports of Los Angeles and Long Beach to newly created transfer centers in the Inland Empire, where products are repackaged and loaded onto trains or put on trucks that go to warehouses.
The two ports generate about 35,000 truck trips per day. That number is expected to more than triple in two decades, according to port officials. The most popular routes for trucks hauling cargo to and from the ports are along the Long Beach, Pomona and San Bernardino freeways.
The Texas Transportation Institute estimated that the Inland Empire needs an additional 78 miles of highways and surface streets each year and enough mass transit to serve an additional 100,000 riders annually to keep congestion from worsening.
Riverside and San Bernardino counties collect a half-cent sales tax to pay for transportation projects. But Roberts and other officials say that isn’t enough and that congestion will worsen unless the state expands freeways and mass transit. Over the past four years, however, state lawmakers have siphoned $2.2 billion in transportation funds generated by a state gasoline tax to solve the state’s budget crisis.
“Until we get adequate transportation funding, we won’t make a dent in this,” said Norm King, executive director of the San Bernardino Associated Governments.
The institute’s annual report offered a bit of good news for Los Angeles-area drivers: Traffic delay on average has dropped slightly in the past four years, which transportation experts attribute to a sluggish economy and ongoing traffic-reduction programs such as added carpool lanes and freeway tow-truck patrols.
Rush-hour commuters in the Los Angeles region spent 93 hours stuck in traffic in 2002, down from 94 hours in 2001, according to the study.
“In the strange world of traffic congestion, not getting worse is a good sign,” said Tim Lomax, a research engineer and co-author of the annual report.
Southern California is not alone in its freeway misery. Congestion has increased in just about every region of the nation, from Eugene, Ore., where delays have nearly doubled in the past decade, to Dallas, where delays have jumped more than 40% in the same period, according to the study.
Throughout the nation, road delays in 85 urban areas studied by the institute cost drivers more than $63 billion in wasted time, extra fuel and car repairs in 2002, a $2-billion increase over the previous year.
*
(BEGIN TEXT OF INFOBOX)
Bumper to bumper
The Riverside-San Bernardino area tied with Dallas-Fort Worth for having the biggest increase in traffic delay from 1982 to 2002, according to the Texas Transportation Institute. But in terms of total hours wasted, Los Angeles-area drivers are stuck in traffic the most: 93 hours a year.
Large urban areas with biggest increase in hours of traffic delay*
Annually per rush-hour traveler
*--* Hours delayed Increase Rank/Area in 1982 in 2002 ‘82-’02 1. Riverside-San Bernardino 9 57 48 hrs. 3. Atlanta 14 60 46 9. Baltimore 9 48 39 9. Minneapolis-St. Paul 3 42 39 9. Orlando 12 51 39 9. San Diego 8 47 39 Average for large urban 10 38 28 areas
*--*
Very large urban areas with biggest increase**
Annually per rush-hour traveler
*--* Hours delayed Increase Rank/Area in 1982 in 2002 ‘82-’02 1. Dallas-Fort Worth-Arlington, 13 61 48 hrs. Texas 3. Los Angeles-Long Beach-Santa Ana 47 93 46 3. Washington, 21 67 46 D.C.-Virginia-Maryland 6. San Francisco-Oakland 30 73 43 7. Miami 11 52 41 Average for very large urban areas 24 62 38
*--*
*More than 1 million and less than 3 million population
**More than 3 million population
Source: Texas Transportation Institute’s 2004 Urban Mobility Report
More to Read
Sign up for Essential California
The most important California stories and recommendations in your inbox every morning.
You may occasionally receive promotional content from the Los Angeles Times.


